
📊 Full opportunity report: Is AI Changing How We Visualize Warzones? on ThorstenMeyerAI.com — validation score, market gap, and execution plan.

Get business pricing on monitors, keyboards and dev gear
- Business-only prices and quantity discounts
- Tax-exempt purchasing
- Multiple users, one account, clear invoices
TL;DR
AI technology is enabling innovative visualizations of conflict zones, blending real-time data with cinematic effects. A new project visualizes Bitcoin trading as a battlefield, illustrating AI’s potential for artistic and analytical purposes. The development raises questions about the future of warzone representation and data interpretation.
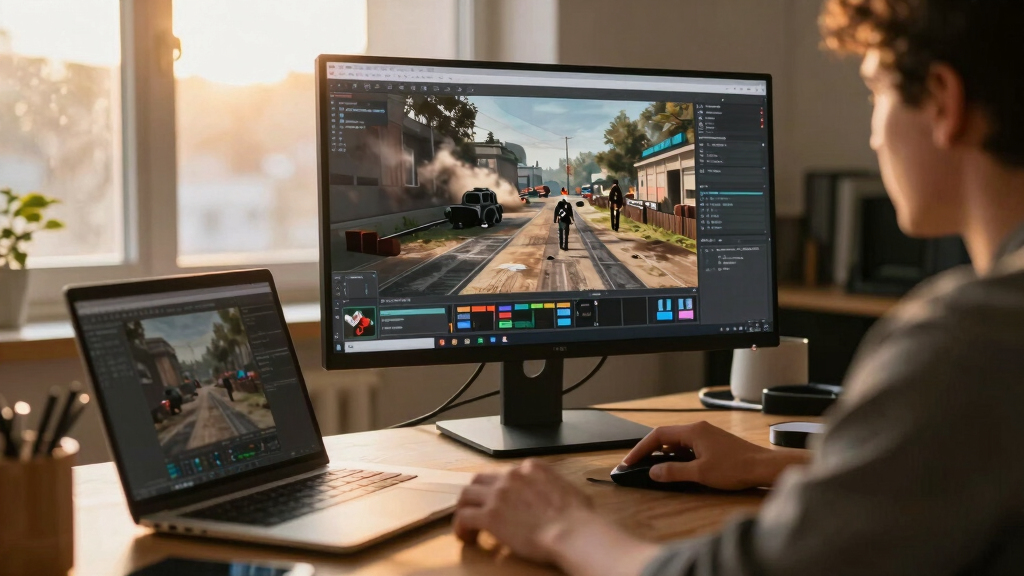
AI-driven visualization tools are increasingly used to depict complex conflict scenarios, and a recent project exemplifies this trend by transforming Bitcoin trading data into a cinematic battlefield. This innovative web-based visualization, called Bitcoin War, uses real-time market data to create a visceral, artistic representation of market activity, highlighting the potential for AI and web technology to reshape how warzones and conflicts are perceived and understood.
The project, accessible at war.isbitcoindead.com, connects directly to cryptocurrency exchange streams, visualizing buy and sell orders as combatants in a war. Large liquidations are represented as airstrikes, and market volatility is tracked via a live DEFCON meter. The entire visualization runs entirely in the browser, utilizing Canvas 2D graphics, WebAudio, and WebSocket streams, with no backend infrastructure involved.
According to the developer, this setup is designed for artistic expression, not trading advice or financial analysis. The system dynamically shifts perspectives with an automatic camera director, and a live war log narrates ongoing market battles. The project emphasizes the chaotic nature of markets through cinematic effects, sound, and real-time data, offering a visceral experience of market activity as a warzone.
Implications of AI-Generated Warzone Visualizations
This development demonstrates how AI and web technologies are expanding the ways we visualize and interpret complex data, including conflict scenarios. While Bitcoin War is an artistic project, it raises broader questions about the future of warzone depiction, the use of AI in conflict visualization, and the potential for such tools to influence public perception of real-world conflicts. The project exemplifies a shift toward immersive, real-time visual storytelling that could impact journalism, military training, and public understanding of conflicts.
real-time data visualization software
As an affiliate, we earn on qualifying purchases.
As an affiliate, we earn on qualifying purchases.
Emergence of Data-Driven Visualizations in Conflict Representation
Recent years have seen a surge in digital tools that visualize conflict zones, from satellite imagery to virtual reality simulations. AI enhances these capabilities by enabling real-time, dynamic representations. Bitcoin War is part of this trend, using live market data as a proxy for conflict, illustrating how web-based AI projects can create cinematic experiences that blur the line between art and data analysis.
While traditional warzone visualization relies on static images or reports, AI-powered tools now offer continuous, immersive perspectives. This project builds on advances in browser technology, WebSocket streaming, and AI-driven graphics, showcasing a new frontier in conflict visualization.
“Bitcoin War exemplifies how browser-based AI visualization can turn market chaos into a visceral war scene, blending art and data.”
— an anonymous researcher
AI-powered conflict visualization tools
As an affiliate, we earn on qualifying purchases.
As an affiliate, we earn on qualifying purchases.
Limitations and Unanswered Questions About AI Warzone Visualizations
It remains unclear how widely such visualizations will be adopted beyond artistic projects, or how they might influence perceptions of real conflicts. The ethical implications of depicting war as a cinematic spectacle are also not yet fully understood. Additionally, the long-term impact of AI-driven visualization tools on public understanding and media coverage of conflicts is still developing.
web-based market data visualization
As an affiliate, we earn on qualifying purchases.
As an affiliate, we earn on qualifying purchases.
Future Developments in AI-Enhanced Conflict Visualization
Further integration of AI with real-world conflict data could lead to more sophisticated, immersive visualizations, potentially used in journalism, military training, or public awareness campaigns. Developers and researchers are likely to explore ethical guidelines and technical improvements to balance realism with responsible portrayal. Monitoring how these tools influence public perception and policy will be a key focus moving forward.
cinematic data visualization display
As an affiliate, we earn on qualifying purchases.
As an affiliate, we earn on qualifying purchases.
Key Questions
Is Bitcoin War intended as a serious conflict visualization tool?
No, Bitcoin War is an artistic and data-driven visualization project that depicts market activity as a cinematic battlefield. It is not designed for conflict analysis or military use.
How does AI contribute to creating these visualizations?
AI and web technologies enable real-time processing, dynamic graphics, and immersive sound, transforming raw data into cinematic visual representations accessible directly in browsers.
Could this technology be applied to real-world warzones?
While similar visualization techniques could be adapted for real conflicts, ethical considerations and accuracy are critical. Currently, projects like Bitcoin War focus on artistic expression rather than real conflict depiction.
What are the potential risks of AI-driven warzone visualizations?
Risks include misinterpretation, sensationalism, and ethical concerns about glamorizing conflict. Responsible use and clear disclaimers are essential to prevent misuse or misunderstanding.
What is the next step for this type of technology?
Future developments may include more immersive virtual reality experiences, integration with real conflict data, and the development of ethical frameworks to guide responsible visualization practices.
Source: ThorstenMeyerAI.com
Columbus Day / Indigenous Peoples' Day Picks
long weekend sales
As an affiliate, we earn on qualifying purchases.