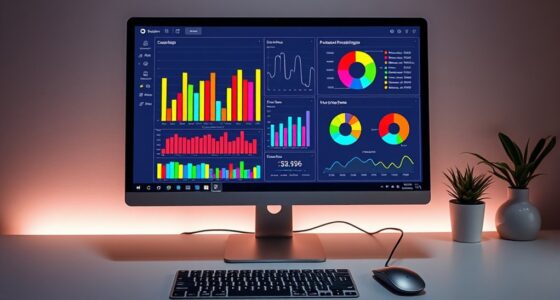
Predictive Analytics Visualization: Forecasting Trends With Charts
Forecasting trends with charts enhances predictive analytics, but mastering visualization techniques is crucial—discover how to unlock clearer insights today.
Navigating real-time IoT data streams with dashboards reveals instant insights that can transform your operations—discover how to build these powerful tools today.
Ethical Data Visualization: Avoiding Bias and Ensuring Transparency
What are the key principles for creating ethical data visualizations that avoid bias and ensure transparency? Keep reading to discover how to build trust and integrity in your visuals.
Interactive 3D Visualizations: Drilling Down Into Complex Data
Fascinating and immersive, interactive 3D visualizations unlock deeper insights into complex data—discover how they can transform your analysis journey.
Augmented Reality Overlays: Contextualizing Data in the Real World
Gaining insights through augmented reality overlays transforms how we interact with information, but the full potential of contextualized data in real-world settings is just beginning.
Virtual Reality Data Visualization: Exploring Data in 3D
Learn how virtual reality data visualization transforms analysis by immersing you in 3D environments that make complex data more accessible and engaging.
Personalized Visualizations: Tailoring Charts to User Preferences
Great personalized visualizations adapt to your preferences, making data analysis more intuitive—discover how tailoring charts can transform your insights.
AI-Powered Data Storytelling: Automating Chart Creation
Keen to transform data into compelling stories effortlessly? Discover how AI-powered chart automation can elevate your presentations—keep reading to learn more.