
Standard deviation shows how spread out individual data points are around the average, revealing data variability. Standard error, on the other hand, indicates how accurately your sample mean estimates the true population mean, decreasing as your sample size grows. While the standard deviation measures dispersion within your data, the standard error focuses on the precision of your sample’s average. Understanding the key difference helps you interpret data more effectively—continue exploring to gain a clearer picture.
Key Takeaways
- Standard deviation measures data spread among individual observations; standard error measures the accuracy of the sample mean as an estimate of the population mean.
- Larger standard deviation indicates more variability in data points; larger standard error suggests less confidence in the sample mean.
- Increasing sample size decreases the standard error, improving the reliability of the mean estimate, while standard deviation may remain unchanged.
- Standard deviation reflects data dispersion within a dataset; standard error assesses the precision of the sample mean across multiple samples.
- Use standard deviation to describe data variability; use standard error to evaluate the reliability of the mean estimate.
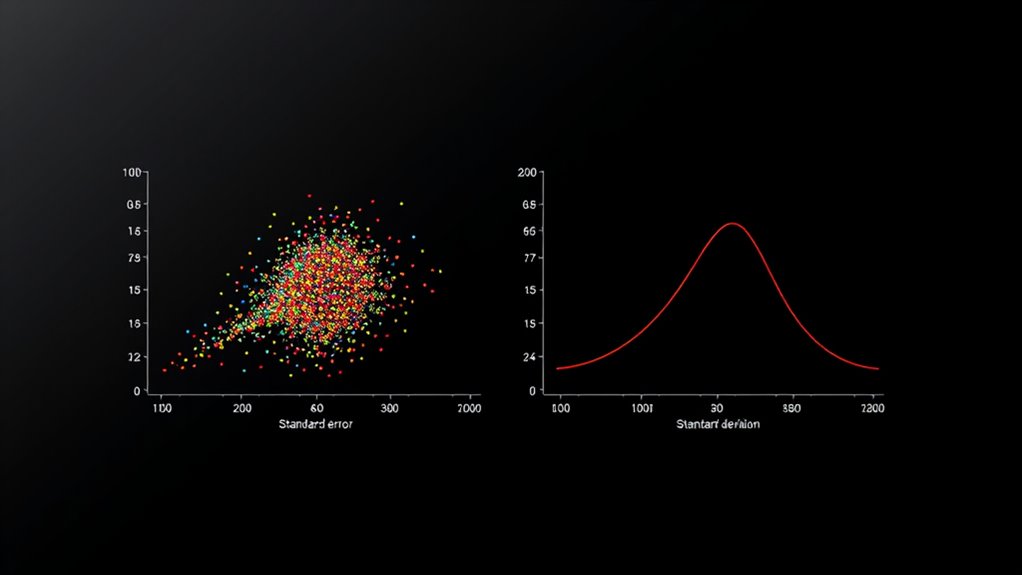
When analyzing data, understanding the difference between standard error and standard deviation is fundamentally important, as they serve distinct purposes in statistics. Both measure data dispersion, but they do so in different contexts and for different reasons. Standard deviation focuses on how data points vary around the mean within a single dataset, revealing the spread or variability among individual observations. It gives you a sense of how tightly or loosely the data cluster around the average, highlighting the overall dispersion of your data points. If your dataset has a high standard deviation, it indicates that the data points are spread out over a wider range; a low standard deviation means they are more closely packed around the mean.
On the other hand, the standard error relates to sampling variability—the degree to which a sample mean might differ from the true population mean. When you take multiple samples from the same population, the sample means won’t all be identical; they’ll fluctuate due to random variation. The standard error quantifies this variability, providing an estimate of how much your sample mean is likely to differ from the true mean of the entire population. It essentially measures the precision of your sample mean as an estimate of the population parameter, helping you understand how reliable your sample data is for making inferences. Additionally, understanding the dispersion of data helps in assessing the overall reliability and variability within your dataset. While standard deviation is about the data itself and describes the spread of individual data points, the standard error is about the accuracy of the sample mean as an estimate of the population mean. As a rule of thumb, the larger your sample size, the smaller your standard error becomes, because larger samples tend to better reflect the true population. Conversely, increasing standard deviation indicates more variability among individual observations, which can happen regardless of sample size, especially if the data are naturally dispersed.
Frequently Asked Questions
How Do I Choose Between Standard Error and Standard Deviation in My Analysis?
You should choose between standard error and standard deviation based on your goal. Use standard deviation to understand data variability within your sample, showing how spread out the data points are. Opt for standard error when you want to estimate how accurately your sample mean reflects the population mean, especially with larger sample sizes. This helps you gauge the precision of your estimate, considering the sample size’s impact on variability.
Can Standard Error Be Larger Than Standard Deviation? Why or Why Not?
Imagine you’re measuring drops of water falling into a pond; sometimes the splash varies, just like data variability. The standard error can be larger than the standard deviation when your sample size is tiny, and you’re trying to estimate the true population mean. In small samples, confidence intervals widen, making the standard error bigger because it reflects the uncertainty in your estimate, not just data spread.
How Does Sample Size Influence Standard Error Calculations?
Your sample size greatly influences the standard error because larger samples reduce variability in the estimate. When your sample size increases, the standard error decreases, making your estimate more precise. Conversely, smaller samples have higher variability, leading to a larger standard error. This relationship shows that increasing the sample size helps you get a more accurate reflection of the population, reducing uncertainty and improving the reliability of your results.
When Should I Report Standard Error Instead of Standard Deviation?
Think of error reporting like a weather forecast: you’d report the standard error when you want to show how precise your estimate is, much like predicting tomorrow’s temperature. Use standard error for variability assessment of your sample mean, especially when comparing groups or estimating population parameters. You report standard deviation when showing how spread out your data points are. This helps your audience understand both the data’s consistency and the accuracy of your estimates.
Are Standard Error and Standard Deviation Used Interchangeably in Research?
You shouldn’t use standard error and standard deviation interchangeably because they serve different purposes in research. Standard deviation measures the spread of individual data points, reflecting variability within a dataset. Standard error estimates the precision of a sample mean, indicating how well it represents the population. Using them interchangeably can lead to misinterpretations in measurement differences and statistical applications, so it is crucial to select the correct one based on your specific analysis.
Conclusion
Understanding the subtle yet significant split between standard error and standard deviation sharpens your statistical skills. By grasping the gist of their differences, you’ll better balance between broad-basing data and pinpointing precision. Don’t dismiss the details—delve diligently into data distinctions to develop a deeper, clearer comprehension. This diligent dedication delivers data-driven decisions with confidence, clarity, and consistency. So, stay savvy, stay sharp, and see the subtle, significant, statistical story behind every dataset.