
If you confuse a sample with a population, you might draw incorrect conclusions about the entire group. A population includes everyone or everything of interest, while a sample is just a smaller part taken from that group. Relying on an unrepresentative sample or using bad sampling methods can lead to biased results. Paying attention to how the data is collected and understanding the difference helps guarantee your findings are accurate. Keep exploring to master this essential concept.
Key Takeaways
- Confusing the entire population with a sample can lead to incorrect generalizations and faulty conclusions.
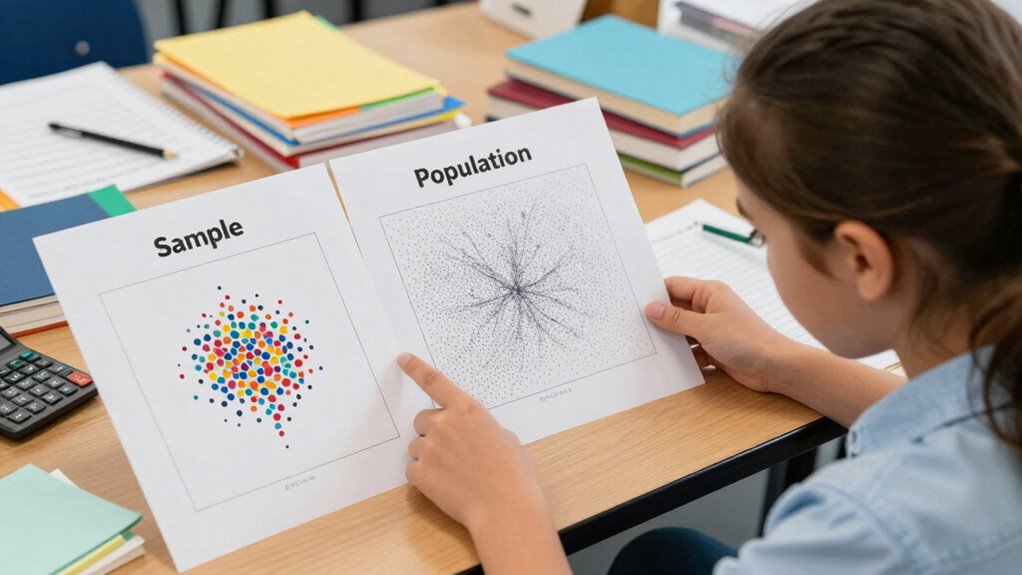
- A sample is a smaller, selected group, while the population includes everyone or everything of interest.
- Proper sampling techniques, like random sampling, are essential to ensure the sample accurately reflects the population.
- Bias occurs when certain groups are over or underrepresented, distorting statistical results.
- Increasing sample size alone doesn’t guarantee representativeness; careful selection methods are crucial.

Have you ever wondered how statisticians draw conclusions about entire groups from just a small portion of data? It’s a fascinating process that hinges on understanding how a sample accurately represents the larger population. When done correctly, sampling allows us to make reliable inferences. But if not careful, sampling bias can creep in, skewing the results and leading to false assumptions. Sampling bias happens when your sample isn’t truly representative of the population, perhaps because certain groups are overrepresented or underrepresented. For example, if you only survey people at a specific location or time, your data might not reflect the whole population’s opinions or characteristics. This poor data representation can lead to misleading conclusions, which is what trips up many students studying statistics.
Understanding the difference between a sample and a population is key here. The population includes everyone or everything you’re interested in studying—like all students in a school or all residents in a city. A sample, on the other hand, is just a subset of that population, selected for analysis. The goal is to choose a sample that mirrors the population as closely as possible. When students confuse the two, they often assume that what’s true for their sample automatically applies to the entire population. That’s not always the case. For example, if your sample consists mostly of teenagers from a particular neighborhood, you can’t confidently say that your findings apply to all teenagers in the city. This is why data representation matters so much. If your sample isn’t representative, your conclusions will be flawed, no matter how large or perfect your data seems.
A representative sample is essential; otherwise, conclusions about the entire population may be flawed.
Many students struggle because they overlook the importance of proper sampling techniques. They may think that simply collecting more data will solve the problem, but size isn’t everything. If the sample isn’t selected carefully, it won’t be representative, and biases will distort the results. To avoid this, statisticians use methods like random sampling, where each member of the population has an equal chance of being chosen. This helps reduce sampling bias and enhances data representation. Incorporating sampling techniques ensures that the sample more accurately reflects the entire population, reducing the risk of skewed results. Additionally, understanding the role of cultural influence can help explain why certain populations might be underrepresented or misinterpreted in data collection. Recognizing sampling bias as a common issue can also help you critically evaluate the quality of data in research studies. Moreover, understanding how sample size impacts the reliability of results can help you determine whether a study’s conclusions are trustworthy.
Ultimately, mastering the difference between the sample and the population, and recognizing the dangers of sampling bias, will help you avoid common pitfalls. It’ll ensure your data truly reflects what you’re studying, leading to more accurate and trustworthy results. By paying attention to how you select and interpret your data, you can confidently navigate the complexities of statistical analysis without falling into the trap of misleading assumptions.

Practical Tools for Designing and Weighting Survey Samples (Statistics for Social and Behavioral Sciences)
As an affiliate, we earn on qualifying purchases.
As an affiliate, we earn on qualifying purchases.
Frequently Asked Questions
How Do I Identify a Sample in Real-World Data?
To identify a sample in real-world data, look for a smaller group selected using sampling techniques like random, stratified, or systematic sampling. This group should represent the larger population, helping you understand data variability. Check if the data set is a subset designed to reflect the entire population’s characteristics. If it’s a manageable portion chosen with specific methods, you’re likely dealing with a sample rather than the whole population.
Can a Sample Be Representative of the Population?
Did you know that properly selected samples can accurately reflect entire populations 95% of the time? A sample can be representative if you use effective sampling methods, like random or stratified sampling, which improve data accuracy. When you choose your sample carefully, it captures the population’s key features, making your conclusions reliable. So, yes, a well-chosen sample can truly mirror the population, giving you meaningful insights.
What Are Common Mistakes When Defining a Population?
When defining a population, you often make mistakes by ignoring sampling techniques and population diversity. You might choose a too narrow or broad group, missing key variations or including irrelevant segments. You should carefully consider which sampling methods best capture the population’s diversity, ensuring your definition accurately reflects the entire group. Avoid assumptions that all members are similar, and tailor your population definition to include relevant characteristics for precise, meaningful analysis.
How Does Sampling Bias Affect Results?
Sampling bias can distort your results more than a tornado tearing through a calm city. It happens when your sampling methods favor certain groups over others, making your sample unrepresentative. This skews data, leading to inaccurate conclusions. To fix this, you need bias correction techniques, ensuring your sample accurately reflects the population. Without this, your findings are as unreliable as a clock that’s always wrong.
When Should I Use a Sample Instead of a Population?
You should use a sample instead of a population when survey methods make it impractical or too costly to gather data from everyone. Sampling allows you to collect data efficiently, saving time and resources. Just guarantee your sample is representative to maintain data accuracy. When properly designed, sampling provides reliable insights without the need to survey the entire population, making it ideal for most research projects.

Asbestos Test Kit – Sample Only Testing – 72hr (3 Business Day) NVLAP lab Result with lab Testing fee Included. (1 Samples)
As an affiliate, we earn on qualifying purchases.
As an affiliate, we earn on qualifying purchases.
Conclusion
So, next time you’re tempted to mix up a sample with the whole population, remember: it’s a common mistake, and that’s what makes statistics so tricky. Ironically, understanding the difference can actually make you a better data detective. So, don’t let confusion trip you up—embrace it as part of the learning journey. After all, in statistics, the biggest mistake is not knowing which is which.

Data Analysis in Microsoft Excel: Deliver Awesome Analytics in 3 Easy Steps Using VLOOKUPS, Pivot Tables, Charts And More
As an affiliate, we earn on qualifying purchases.
As an affiliate, we earn on qualifying purchases.

Seravyne 6.2" Galton Board – Probability Demonstrator, Normal Distribution Statistics Teaching Aid for Science Education
【Visualizes How Order Emerges from Randomness】This Galton Board desk toy is a probability demonstration model. Watch the beads…
As an affiliate, we earn on qualifying purchases.
As an affiliate, we earn on qualifying purchases.