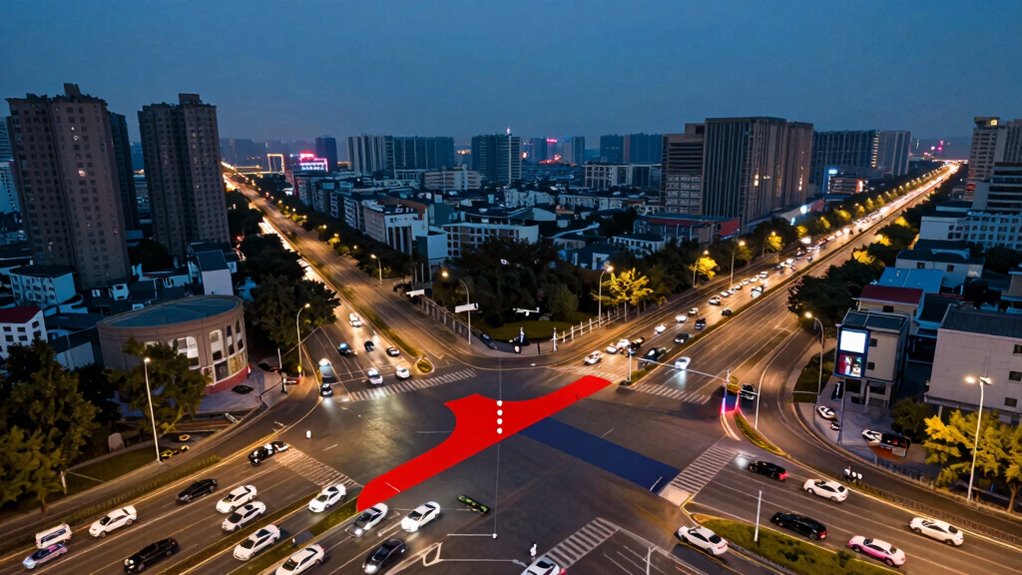

By analyzing traffic safety data, you can identify risky roads through patterns of accidents and driver behaviors. Analysts look for locations with frequent crashes, especially where risky actions like speeding or distracted driving occur. They also examine infrastructure issues like poor signage or road design. This combined approach helps reveal danger zones and the factors behind them. Keep exploring, and you’ll discover how these insights lead to targeted safety improvements that protect everyone.

Get business pricing on monitors, keyboards and dev gear
- Business-only prices and quantity discounts
- Tax-exempt purchasing
- Multiple users, one account, clear invoices
Key Takeaways
- Analysts examine crash frequency and severity data to identify locations with high accident rates.
- They analyze driver behavior patterns, such as speeding or distracted driving, at specific road segments.
- Infrastructure assessments reveal hazards like poor signage, lighting, or road design linked to accident hotspots.
- Advanced data analysis uncovers hidden trends and correlations between environmental factors and crash occurrences.
- Comparing safety measures and infrastructure changes over time helps determine their effectiveness in reducing risks.

Traffic safety data provides essential insights into the factors contributing to road accidents and injuries. When analysts review this data, they focus on patterns that reveal where and why crashes happen. Your role involves understanding how driver behavior and road infrastructure influence these incidents. By examining driver behavior, analysts can identify risky actions like speeding, distracted driving, or failure to obey traffic signals. These behaviors often account for a significant portion of accidents, so recognizing their prevalence helps target safety improvements. For instance, data might show that a high percentage of crashes occur during certain times of day or in specific locations where aggressive driving or inattentiveness is common. This insight enables authorities to implement measures such as increased signage, public awareness campaigns, or stricter enforcement in those areas.
At the same time, the analysis of road infrastructure plays a fundamental role. Poorly designed or maintained roads can create hazards that lead to accidents, regardless of driver behavior. Traffic safety data helps pinpoint these problem spots—whether it’s sharp curves without adequate signage, poorly lit intersections, or confusing lane markings. When you analyze crash reports, you start to see patterns where infrastructure issues coincide with high accident rates. Addressing these issues might involve redesigning intersections, adding lighting, installing guardrails, or improving signage. These changes can drastically reduce risks by making the environment safer for all road users. Additionally, understanding how projector technology enhances visual clarity can be analogous to how better signage and lighting improve driver perception and reaction times. Incorporating advanced data analysis techniques can also uncover hidden trends that might otherwise go unnoticed. Moreover, considering the increasing prevalence of electric bikes and other alternative transportation, safety measures should also adapt to these evolving road users. Recognizing the importance of security zone info can also help in designing safer environments, as it highlights the need for comprehensive safety measures across different areas.
As you dig deeper into the data, you realize that the interplay between driver behavior and infrastructure often amplifies risk. For example, a driver might be more prone to speeding on a wide, straight road that lacks adequate speed limit signs or visual cues. Conversely, poorly maintained roads can cause even cautious drivers to lose control. Your job is to connect these dots—understanding how behavior and environment contribute to accidents helps prioritize interventions. Traffic safety data also helps evaluate the effectiveness of past measures, showing whether new signs, increased enforcement, or infrastructure upgrades have made a difference.
Ultimately, your goal is to use this data to identify the most hazardous roads and behaviors, then recommend targeted actions to improve safety. By analyzing patterns in driver behavior and evaluating the quality of road infrastructure, you contribute to safer roads for everyone. This approach not only saves lives but also reduces injuries and property damage, making a tangible difference in your community.
As an affiliate, we earn on qualifying purchases.
Frequently Asked Questions
How Is Real-Time Traffic Data Collected and Analyzed?
You collect real-time traffic data through sensors, cameras, and GPS devices that monitor traffic flow and driver behavior. This data gets transmitted instantly to analysis systems where algorithms process it to identify congestion, accidents, or risky driving patterns. By analyzing traffic flow and driver behavior in real time, you can make quick decisions, improve safety, and optimize traffic management to reduce accidents and enhance road safety effectively.
What Technologies Are Used to Identify Risky Roads?
Think of it as a high-tech treasure hunt for safer roads. You use vehicle sensorization to gather real-time data, like speed and braking patterns, while predictive modeling helps forecast potential trouble spots. These advanced technologies work together to spot risky roads before accidents happen. By analyzing this info, you can prioritize safety improvements, making your driving experience smoother and safer for everyone.
How Do Weather Conditions Affect Traffic Safety Data?
Weather conditions markedly impact traffic safety data because weather patterns influence driving behavior and road surface conditions. You’ll notice more accidents during rain, snow, or fog, which reduce visibility and make roads slippery. Analysts track these patterns to identify risk factors. By analyzing data on weather and road surface conditions, they can predict hazardous areas and times, helping to implement targeted safety measures and improve overall road safety for everyone.
Can Traffic Safety Data Predict Future Accident Hotspots?
You can often predict future accident hotspots by analyzing historical accident trends and conducting thorough infrastructure assessments. When data reveals patterns of frequent crashes, it hints at underlying risks yet to be addressed. If you stay vigilant and interpret these trends carefully, you might prevent tragedy before it happens. The key lies in proactive analysis—spotting warning signs early and improving infrastructure to keep everyone safer on the roads.
How Is Data Privacy Maintained During Traffic Analysis?
You maintain data privacy during traffic analysis by using anonymized data, stripping away personal identifiers to prevent tracking individuals. Additionally, you follow strict privacy protocols, ensuring data is securely stored and accessed only by authorized personnel. This approach safeguards driver and pedestrian information while allowing analysts to identify risky roads effectively. By combining anonymization with robust privacy practices, you protect individual privacy without compromising traffic safety insights.
As an affiliate, we earn on qualifying purchases.
Conclusion
You now see how traffic safety data acts like a flashlight in the dark, illuminating the dangerous corners of our roads. With each data point, you’re guiding your community away from hidden hazards, turning potential crashes into safer journeys. Imagine a world where every mile you drive feels more secure, thanks to the careful analysis that spots risky spots before they cause harm. It’s your ride—made safer, one data point at a time.
driver distraction prevention devices
As an affiliate, we earn on qualifying purchases.
As an affiliate, we earn on qualifying purchases.
road infrastructure safety improvements
As an affiliate, we earn on qualifying purchases.
As an affiliate, we earn on qualifying purchases.
Fall Picks
fall essentials
As an affiliate, we earn on qualifying purchases.