To make SPSS and Excel easier to use, set up dual monitors at eye level. This setup lets you view both applications simultaneously, enhancing efficiency and reducing workflow disruptions. Keep your screens an arm’s length away to prevent eye strain, and consider high-resolution monitors for better clarity. Familiarizing yourself with keyboard shortcuts can streamline your tasks, too. If you want to discover more tips for optimizing your workspace, there’s plenty more to explore.
Key Takeaways
- A dual monitor setup allows simultaneous use of Excel and SPSS, enhancing efficiency and reducing workflow disruptions.
- Position monitors at eye level and an arm’s length away to minimize eye strain and improve comfort during long analysis sessions.
- High-resolution screens provide visual clarity, making it easier to read small data points and interpret complex graphs.
- Familiarize yourself with software shortcuts to streamline your workflow and reduce time spent navigating menus in SPSS and Excel.
- Keep your workspace organized and clutter-free to enhance focus and facilitate quick access to files during data analysis.

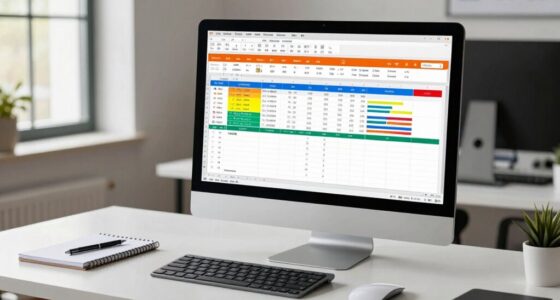
Setting up your monitor for SPSS and Excel can greatly enhance your productivity and comfort while working with data. One of the best ways to accomplish this is by using a dual monitor setup. With two screens, you can have Excel open on one side while analyzing data in SPSS on the other. This arrangement allows you to cross-reference information without constantly switching tabs, which can disrupt your workflow. The increased screen real estate makes it easier to keep track of your data and results, enhancing your overall efficiency. Proper filtration and suction from your workspace environment can help keep your monitors free of dust and debris, ensuring clear visibility. Ergonomic positioning is another critical factor to take into account. Make sure that your monitors are at eye level, so you’re not straining your neck or back while working. Positioning the screens about an arm’s length away will help reduce eye strain. If you spend long hours in front of screens, investing in adjustable monitor stands can make a considerable difference. You’ll find that a comfortable workspace contributes to better focus and productivity, allowing you to immerse yourself in your data analysis. Screen resolution plays an essential role in how clearly you can see your data. Opt for monitors with high resolution to guarantee that everything from tiny Excel cells to complex SPSS graphs is sharp and readable. High-resolution displays also enhance visual clarity, making it easier to spot trends and anomalies in your datasets. This clarity can save you time and reduce frustration, especially when you’re working with large volumes of data. Utilizing software shortcuts can also streamline your workflow. Familiarize yourself with keyboard shortcuts for both SPSS and Excel. These shortcuts can greatly reduce the time you spend maneuvering through menus, enabling you to focus more on your analysis. You’ll be amazed at how much more efficient you can be when you’re not constantly reaching for the mouse. Finally, think about workspace organization. Keep your desk clear of clutter so you can focus on your monitors without distractions. Organize your files and data sets in a way that allows you to easily access them while working on your projects. A tidy workspace fosters a clear mind, which is essential when dealing with complex data. Additionally, understanding the importance of visual clarity and how it impacts data interpretation can help you choose the best display settings for your needs. Paying attention to monitor calibration can further improve your ability to distinguish subtle differences in data points, which is crucial for accurate analysis. Proper monitor setup ensures that your visual environment is optimized for precise data review and interpretation.

Kado 2-Pack Dual 27" Curved 1500R 1920×1080 75Hz FHD Computer Monitor
DUAL MONITOR SETUP – Curved monitors in a dual setup provide a seamless viewing experience with reduced peripheral…
As an affiliate, we earn on qualifying purchases.
As an affiliate, we earn on qualifying purchases.
Frequently Asked Questions
What Types of Monitors Are Best for SPSS and Excel?
For SPSS and Excel, you’re best off with a larger monitor, ideally 27 inches or more, as it provides ample screen real estate for multitasking. A screen curvature can enhance your viewing experience, offering better immersion and reducing eye strain. Look for a monitor with high resolution, too—this makes data clearer and easier to work with. Ultimately, prioritize comfort and clarity to boost your productivity.
How Many Monitors Do I Need for Optimal Productivity?
You need at least two monitors for ideal productivity—unless you enjoy squinting at a single screen like it’s a treasure map! A proper monitor arrangement enhances workspace ergonomics, allowing you to multitask effortlessly. You can keep SPSS up on one screen while analyzing data in Excel on the other. This setup not only boosts efficiency but also reduces eye strain, letting you focus on what truly matters—getting the job done.
Can I Use a Laptop With External Monitors?
Yes, you can definitely use a laptop with external monitors. Most laptops support monitor integration via HDMI, DisplayPort, or USB-C connections. Just check your laptop compatibility to confirm it can handle multiple displays. Once connected, you can extend your desktop or mirror your screen, enhancing your productivity. It’s a great way to create a more spacious work environment, making tasks like data analysis or spreadsheet management much easier and more efficient.
What Resolution Is Ideal for Data Analysis Tasks?
For data analysis tasks, an ideal resolution is 1920×1080 pixels, especially on a screen size of 24 to 27 inches. This pixelation guarantees clarity, allowing you to view detailed charts and datasets without straining your eyes. Higher resolutions, like 2560×1440, can enhance your experience even more, but verify your laptop can support it. Ultimately, choose a setup that balances screen size and resolution for the best data analysis experience.
Are There Specific Monitor Brands Recommended for Analysts?
When it comes to monitors, you can’t go wrong with brands like Dell, ASUS, or BenQ! They offer ergonomic features that’ll make your back sing with joy, and their color accuracy is so vibrant you’d think you’re staring at a masterpiece! For budget options, look for models around 24 to 27 inches that fit your workspace perfectly. A larger screen size can turn your data analysis into a visual delight, making every detail pop!

BoYata Monitor Stand, Adjustable Monitor Riser Metal Computer Stand Compatible with TV, PC, Laptop, Computer, iMac, and All Screen Display-Black
Adjustable Height: Unlike the traditional stand, our monitor stand has an adjustment twist knob that can adjust the…
As an affiliate, we earn on qualifying purchases.
As an affiliate, we earn on qualifying purchases.
Conclusion
By setting up your monitors just right, you’ll reveal the secret to SPSS and Excel mastery! Imagine gliding through your data like a wizard, effortlessly conjuring insights that seemed impossible before. With an expansive view, you’ll feel like you’re piloting a spaceship through a galaxy of numbers, leaving confusion in the dust. So, don’t settle for anything less—transform your workspace and watch your productivity soar to stratospheric heights! You’ll wonder how you ever managed without it!

SAMSUNG 34" ViewFinity S50GC Series Ultra-WQHD Monitor, 100Hz, 5ms, HDR10, AMD FreeSync, Eye Care, Borderless Design, PIP, PBP, LS34C502GANXZA, 2023, Black
DO MORE ON ONE SCREEN: See every detail on the wider display featuring a 21:9 aspect ratio; Ultra…
As an affiliate, we earn on qualifying purchases.
As an affiliate, we earn on qualifying purchases.

HUANUO FlowLift™ Dual Monitor Stand, Fully Adjustable Gaming Monitor Desk Mount for 13–32″ Computer Screens, Full Motion VESA 75×75/100×100 with C-Clamp & Grommet Base, Each Arm Holds 4.4 to 19.8 lbs
Compatible with Wide Screens – To ensure compatibility with the dual monitor mount, your each monitor must meet…
As an affiliate, we earn on qualifying purchases.
As an affiliate, we earn on qualifying purchases.