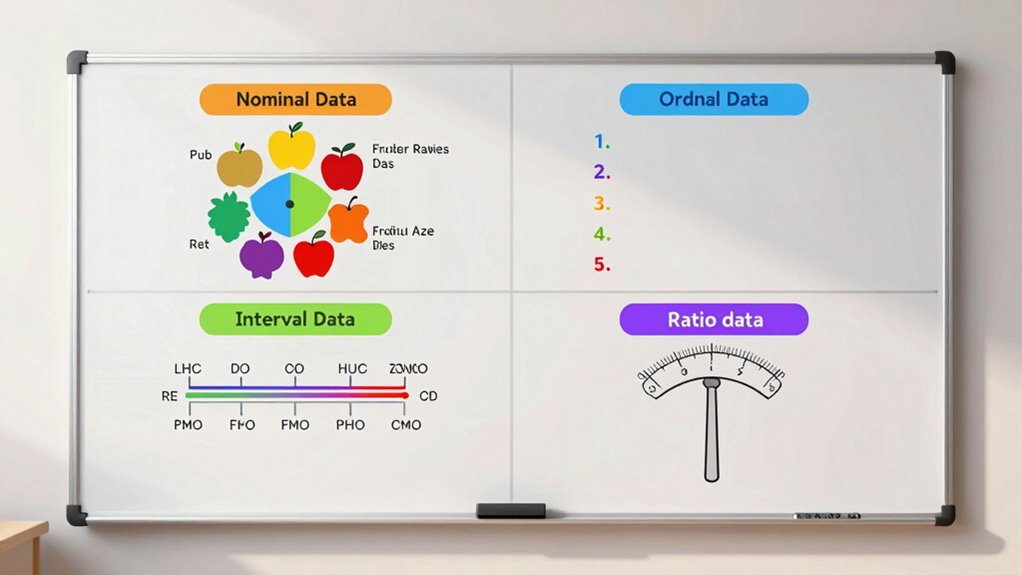

Understanding the four main types of data—nominal, ordinal, interval, and ratio—is essential for accurate analysis. Nominal data involves categories without order, like colors or names. Ordinal data ranks items but doesn’t measure differences, such as satisfaction levels. Interval data has equal spacing between values, like temperature, but no true zero. Ratio data includes a meaningful zero, like height or income. Keep exploring to discover how each type influences data interpretation and statistical choices.
Key Takeaways
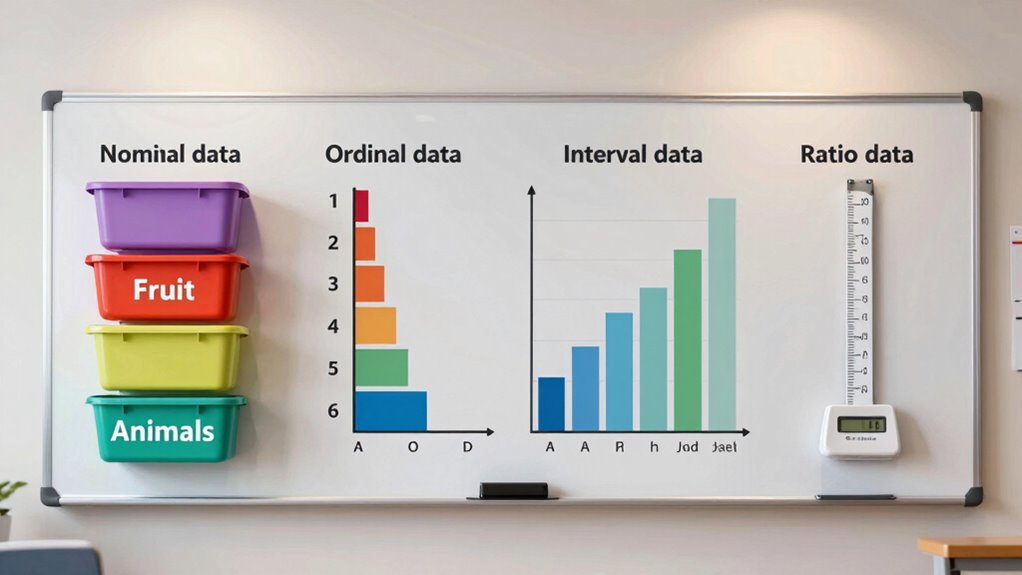
- Nominal data categorizes without order, such as colors or types of fruit, and analysis is limited to counts and modes.
- Ordinal data ranks categories, like satisfaction levels, showing relative position but not equal spacing.
- Interval data has equal intervals between values, like temperature, but lacks a true zero, allowing mean calculations.
- Ratio data includes a true zero point, enabling meaningful ratios, such as height, weight, or income.
- Recognizing the properties of each scale ensures appropriate statistical methods and accurate data interpretation.
Understanding data measurement types is essential because they determine how you collect, analyze, and interpret information. When working with data, you’ll encounter different measurement scales, each suited to specific types of data. Recognizing these scales helps you choose the right methods for data coding and analysis, ensuring your results are accurate and meaningful.
The first type, nominal data, involves categories that have no inherent order. Think of it as labels or names used to identify different groups. For example, if you’re collecting data on colors or types of fruit, these are nominal. You assign codes to each category, but the codes don’t imply any ranking or hierarchy. Data coding here is straightforward: each category gets a label, making it easy to group and count. Because nominal data lacks order, you can only perform basic analyses, like frequency counts or mode calculations.
Next, you have ordinal data, which introduces a sense of order or ranking. Imagine ranking customer satisfaction as “unsatisfied,” “neutral,” and “satisfied.” While these categories show a clear order, the intervals between them aren’t necessarily equal. For instance, the difference in satisfaction between “unsatisfied” and “neutral” might not be the same as between “neutral” and “satisfied.” This is where measurement scales shine—they help you understand the relative position of data points but don’t specify the exact difference. When performing data coding, you assign numbers that reflect rank, such as 1 for “unsatisfied” and 3 for “satisfied,” but avoid assuming equal spacing between ranks. Analyses for ordinal data include median and rank correlation, which respect the order but don’t assume equal intervals. Recognizing measurement scale properties ensures your interpretations remain valid.
Interval data takes things further. Here, the measurement scale has equal intervals between values, like temperature in Celsius or Fahrenheit. In this case, data coding involves assigning numerical values that accurately reflect these equal intervals. You can perform more detailed analyses, such as calculating means and standard deviations, because the intervals are consistent. However, interval data lacks a true zero point, meaning ratios don’t make sense (e.g., 20°C isn’t twice as hot as 10°C). Additionally, some projectors support calibration techniques to improve color accuracy, which is crucial for achieving true-to-life images.
Finally, ratio data is the most precise type, with all the features of interval data plus a meaningful zero point. This allows for ratio comparisons, such as “twice as much” or “half as many.” Examples include height, weight, or income. When working with ratio data, your measurement scales enable a wide range of statistical operations, from averages to ratios. Data coding here assigns numerical values that reflect actual quantities, making ratio data the most versatile for analysis.
nominal data coding tools
As an affiliate, we earn on qualifying purchases.
As an affiliate, we earn on qualifying purchases.
Frequently Asked Questions
How Do I Choose the Right Data Type for My Project?
To choose the right data type for your project, start with data classification—consider what kind of data you’re working with and its purpose. Think about data transformation needs; some data types require conversion for analysis. If you’re measuring quantities, ratio data might be best. For categories, nominal or ordinal are suitable. Matching your data classification to your analysis goals guarantees accurate insights and effective data transformation.
Can Data Change From One Type to Another?
Yes, data can change from one type to another through data transformation. You might classify data differently depending on your analysis needs or project goals. For example, you could convert nominal data into ordinal data by establishing a ranking, or transform interval data into ratio data by adding a true zero point. Understanding data classification helps you decide which transformations are appropriate, ensuring your analysis remains accurate and meaningful.
What Are Common Mistakes When Classifying Data?
When classifying data, you often make mistakes by rushing or misjudging the nature of your data. You might overlook data consistency, leading to incorrect classification. Common errors include choosing the wrong data type because you don’t understand the data’s scale or purpose, or mixing data types that don’t align. Always double-check your data classification to verify it reflects the true nature of your data, avoiding these common pitfalls.
How Does Data Type Affect Statistical Analysis?
Your data type dramatically influences your statistical analysis—it’s like choosing the right key for a lock. If you ignore measurement scales, you risk disastrous data transformations, leading to invalid results. For example, transforming nominal data as if it were ratio data can skew insights. Recognizing whether your data is nominal, ordinal, interval, or ratio guides proper analysis methods, ensuring your conclusions are valid and meaningful rather than misleading or outright wrong.
Are There Tools to Automatically Identify Data Types?
Yes, there are tools that automatically identify data types through machine learning and data categorization techniques. These tools analyze your dataset’s structure, patterns, and values to classify data accurately. They save you time and reduce errors compared to manual classification. By leveraging machine learning algorithms, they adapt to different data formats and help you prepare your data for analysis more efficiently, ensuring your statistical methods are appropriately applied.
ordinal data analysis software
As an affiliate, we earn on qualifying purchases.
As an affiliate, we earn on qualifying purchases.
Conclusion
By now, you’ve got a clear grasp of the four data measurement types—nominal, ordinal, interval, and ratio. Remember, choosing the right type is like selecting the perfect sword in a medieval quest; it determines how you analyze and interpret your data. Don’t forget, even in your modern-day research, understanding these basics can save you from a potential “Gadzooks!” moment when your data misleads you. Keep these concepts handy—your future analyses will thank you!
interval data temperature sensors
As an affiliate, we earn on qualifying purchases.
As an affiliate, we earn on qualifying purchases.
ratio data measurement devices
As an affiliate, we earn on qualifying purchases.
As an affiliate, we earn on qualifying purchases.