
To visualize data with Matplotlib and Seaborn, you’ll start by creating static plots like histograms, boxplots, and scatterplots with Matplotlib, which offers flexibility and control. Then, enhance these visuals using Seaborn’s styled, informative charts such as violinplots and distribution plots that simplify understanding data distributions and patterns. These tools help you transform raw numbers into clear stories. Keep exploring further, and you’ll discover even more effective ways to communicate your data insights.
Key Takeaways
- Use Matplotlib for creating static, customizable plots and basic visualizations in Python.
- Leverage Seaborn to generate styled, informative statistical visuals like distributions and boxplots.
- Combine Matplotlib and Seaborn to enhance the visual appeal and clarity of your data presentations.
- Utilize Seaborn’s functions such as `distplot`, `boxplot`, and `violinplot` for distribution analysis.
- Customize plots with labels, titles, and colors to improve storytelling and data comprehension.

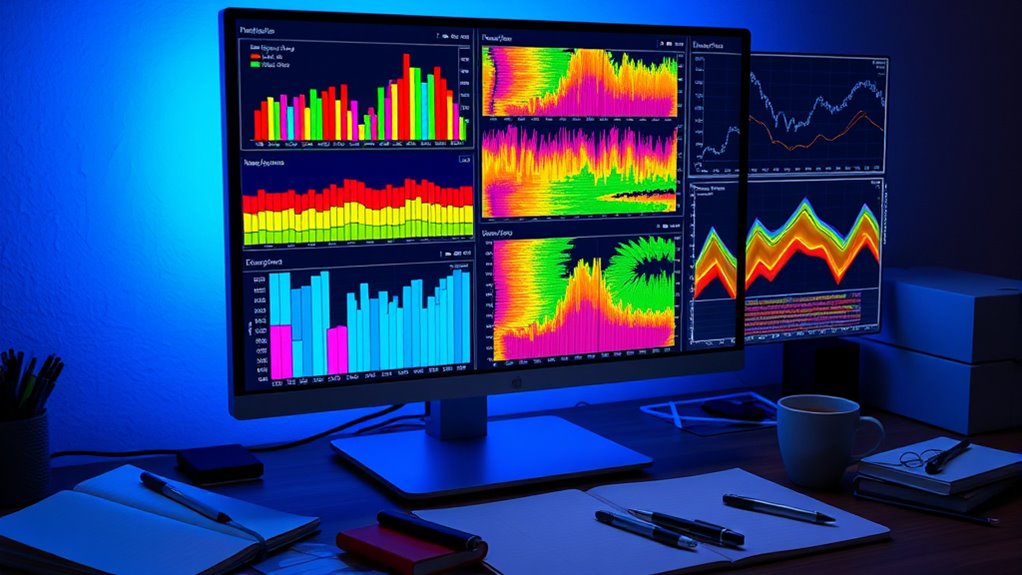
Data visualization transforms complex information into clear, compelling visuals that make insights immediately understandable. When you work with data, it’s one thing to see raw numbers in a spreadsheet, but it’s another to create visualizations that reveal patterns, trends, and distributions at a glance. With tools like Matplotlib and Seaborn, you can craft a variety of visual representations that turn abstract data into meaningful stories. Interactive charts are especially powerful because they allow you to explore data dynamically, zooming in on specific points or filtering information in real-time. This interactivity helps uncover insights that static images might hide, enabling you to dig deeper into your data’s structure. Understanding the importance of data privacy and consent is crucial when sharing visualizations that contain sensitive information. Statistical distributions are fundamental to understanding your data’s behavior. They tell you how data points are spread out, whether your data is skewed, or if there are any outliers. Visualizing these distributions helps you grasp the underlying characteristics of your dataset quickly. For example, histograms and kernel density estimates can illustrate the shape of the distribution, revealing whether data is normally distributed or heavily skewed. Seaborn, built on top of Matplotlib, makes it straightforward to generate these kinds of plots with minimal code, providing aesthetically pleasing and informative visuals that enhance your analysis. Interactive charts take your data visualization a step further by integrating features that let you manipulate data views directly. You can add sliders, dropdowns, or tooltips to your plots, giving users or yourself more control over what’s displayed. This makes it easier to examine specific segments of your data or compare different subsets without creating multiple static images. Such interactivity is particularly useful in presentations, dashboards, or exploratory data analysis, where understanding the nuances can lead to more accurate conclusions. When you leverage Matplotlib for static plots and Seaborn for more advanced, styled visualizations, you gain the ability to visualize statistical distributions with clarity. Seaborn’s functions like `distplot`, `boxplot`, or `violinplot` help you illustrate the spread and density of your data, making it simple to identify skewness, kurtosis, or outliers. Combining these with interactive chart libraries like Plotly or Bokeh allows you to enhance static plots into interactive experiences, making your data storytelling more engaging and insightful. In essence, mastering data visualization with these tools empowers you to communicate complex insights more effectively. Whether you’re exploring statistical distributions or creating interactive charts, your ability to visualize data determines how well you understand it—and how convincingly you can present your findings.
Frequently Asked Questions
How Do I Customize Plot Styles and Themes in Matplotlib?
To customize plot styles and themes in matplotlib, you can use the `style.use()` function to set predefined styles like ‘ggplot’ or ‘seaborn’. You can also create your own style sheet with custom settings for colors, fonts, and line widths. For theme setting, adjust rcParams directly or use `matplotlib.style.context()` for temporary changes, giving you full control over your plot’s appearance.
What Are the Best Practices for Handling Large Datasets?
Handling large datasets is like managing a flood—you need to control the flow. Use data sampling to reduce the dataset size, focusing on representative samples for faster analysis. Optimize memory by loading only necessary data, converting data types, or processing chunks incrementally. These practices keep your workflow smooth, prevent crashes, and allow you to visualize insights effectively without being overwhelmed by the data’s volume.
Can Seaborn Visualize Non-Numeric Data Effectively?
Yes, Seaborn can effectively visualize non-numeric data, especially categorical data. You can create bar plots, count plots, or box plots to display categories clearly. To enhance understanding, add text annotations that label categories or provide counts directly on the plot. This approach makes it easier to interpret non-numeric data visually, helping you communicate insights more effectively through your visualizations.
How to Export High-Resolution Images for Publication?
Ever wonder how to get crisp, publication-ready images? You simply set the image resolution with the dpi parameter and adjust figure size to match your needs. When saving, use plt.savefig(‘filename.png’, dpi=300, bbox_inches=’tight’) to guarantee high-quality output. This way, your visualizations will look sharp and professional, perfect for print or presentation, with the right balance of resolution and size for any publication standard.
Are There Interactive Visualization Options With Matplotlib or Seaborn?
You can create interactive dashboards and animated plots with matplotlib and seaborn by integrating them with libraries like Plotly or Bokeh. These tools allow you to add interactivity, such as zooming, hovering, and sliders, enhancing your visualizations. While seaborn and matplotlib focus on static images, combining them with these libraries makes your visualizations more engaging, enabling you to explore data dynamically and share interactive insights easily.
Conclusion
Now, with matplotlib and seaborn, you hold the brush to paint vivid stories from your data. Imagine a canvas where each color and line reveals hidden patterns—your insights come alive in dynamic visuals. As you refine your plots, you’re crafting a clear window into complex information, making the unseen seen. Keep experimenting, and soon you’ll turn raw numbers into compelling visual tales that captivate and inform anyone who looks.