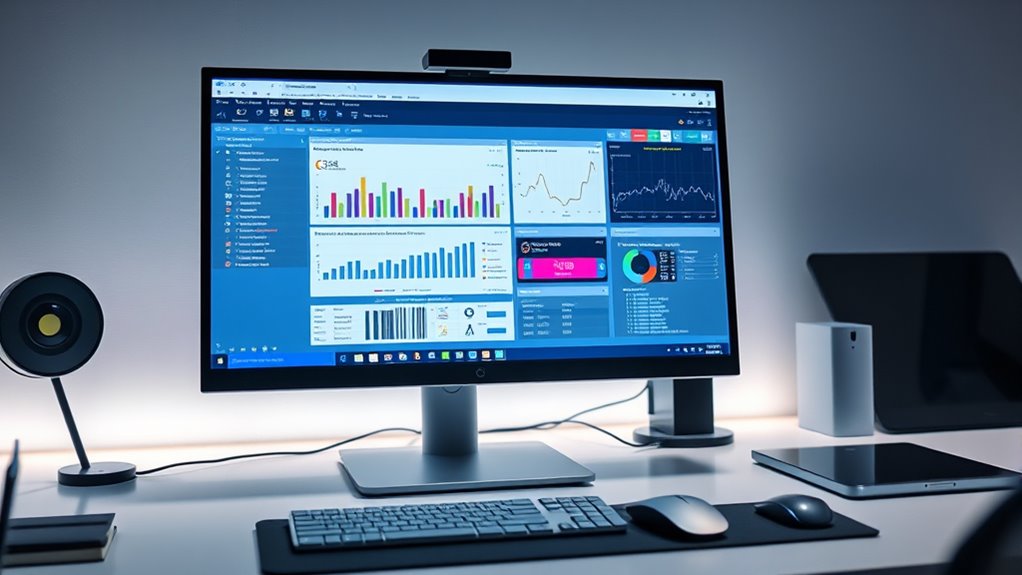

Start exploring the JMP interface by importing your dataset into the main data table. Use the easy menu options to create visualizations like scatter plots, bar graphs, and box plots, which help you spot patterns and outliers quickly. Automate repetitive tasks with JSL scripting to save time and customize your analysis. With these simple steps, you’ll get comfortable steering and making the most of JMP’s powerful features—keep going to discover even more tools and tips.
Key Takeaways
- Learn to quickly navigate the JMP interface for importing, organizing, and manipulating data efficiently.
- Explore how to create and customize visualizations like bar graphs, scatter plots, and box plots.
- Understand how to record actions and generate JSL scripts to automate tasks and analyses.
- Use the script editor for writing, editing, and debugging code to streamline workflows.
- Discover tips for building dashboards and reports to enhance data presentation and sharing.

Are you ready to explore the JMP interface and open its powerful data analysis capabilities? When you first launch JMP, you’ll notice its user-friendly layout designed to make data exploration intuitive. The interface centers around the data table, where you can import, organize, and manipulate your datasets with ease. From here, you can immediately start creating data visualizations to uncover insights visually. JMP offers a wide range of chart types, including bar graphs, scatter plots, and box plots, all accessible through simple menu options. These visualizations help you identify patterns, outliers, and relationships quickly, making your analysis more effective and engaging.
As you become more comfortable with the interface, you’ll discover the scripting automation features that elevate your workflow. JMP’s scripting language, JSL (JMP Scripting Language), allows you to automate repetitive tasks and customize analyses. For instance, instead of manually generating the same set of reports or visualizations, you can write scripts that perform these actions automatically. This saves you valuable time, especially when working with large datasets or conducting complex analyses repeatedly. The scripting environment is integrated into the interface, with a script editor window that provides syntax highlighting and debugging tools. You can start with simple scripts to automate chart creation or data cleaning processes and gradually move on to more advanced workflows.
Navigating the JMP interface for scripting is straightforward. You can record actions directly from the GUI using the scripting options, which generate the corresponding code. This feature helps you learn JSL syntax by example, reducing the learning curve. Moreover, the scripting environment supports modularity—allowing you to write reusable functions and scripts that can be applied across projects. JMP also facilitates the integration of scripts into dashboards and reports, enabling you to present your findings professionally. The interface’s flexibility means you can blend manual data visualization with scripting automation to streamline your entire analysis process. Additionally, understanding the importance of color accuracy can enhance the clarity of your visualizations, making your insights more impactful.
Top picks for "interface fast track"
Open Amazon search results for this keyword.
As an affiliate, we earn on qualifying purchases.
Frequently Asked Questions
How Do I Customize the JMP Interface Layout?
You can customize the interface layout by accessing the layout modification options in JMP. Start by clicking on the “View” menu, then select “Customize Window” or “Layout.” From there, you can drag and resize panels, add or remove toolbars, and adjust window arrangements to suit your workflow. This interface customization helps you streamline your work environment and makes it easier to access the tools you use most often.
Can I Integrate JMP With Other Data Analysis Tools?
Imagine your data as a flowing river, ready to merge with other streams. Yes, you can integrate JMP with third-party tools for seamless data integration. By connecting JMP to platforms like R, Python, or SQL databases, you expand your analysis horizon. This allows you to harness the strengths of multiple tools, making your insights richer and more extensive. Just set up APIs or export-import options to make the data flow effortlessly.
What Are Common Troubleshooting Steps for Interface Issues?
When facing interface issues, start by checking interface connectivity, ensuring all cables and network connections are secure. If you encounter troubleshooting error messages, note their details, then restart the application or device to clear temporary glitches. Verify that your software and drivers are up to date. If problems persist, consult the user manual or support resources for specific error codes, and consider reinstalling the software if necessary.
How Do I Update JMP to the Latest Version?
Think of updating JMP as upgrading your vehicle for a smoother ride. To do this, you’ll need to check for the latest software updates through the Help menu or the JMP website. Download and install the newest version, making sure it’s compatible with your system to avoid any version compatibility issues. Keeping your software current guarantees you benefit from improvements, bug fixes, and new features, making your JMP experience seamless.
Are There Keyboard Shortcuts for Faster Navigation?
You’re wondering if there are keyboard shortcuts to boost navigation efficiency. Yes, JMP offers various shortcuts that help you move quickly through menus, tools, and data. For example, pressing Ctrl + Z undoes actions, while Ctrl + C copies, and Ctrl + V pastes. Learning these shortcuts saves time and makes your workflow smoother. Explore JMP’s documentation or customize shortcuts to suit your needs for even faster navigation.
Conclusion
Now that you’ve mastered the JMP interface, you’re ready to analyze data like a seasoned pro. Remember, just like a Swiss Army knife, this tool has many features waiting to be explored. Don’t be afraid to experiment and uncover insights. As they say in the old days, “The proof of the pudding is in the eating,” so plunge in and put your new skills to work—your data adventures await!