
In AP Statistics, you need a reliable calculator that simplifies both basic and advanced calculations. Look for graphing capabilities for quick data visualization and tools for statistical analyses, like means and standard deviations. Data analysis features, such as sorting and frequency tables, help turn raw data into insights. Regression tools aid in understanding variable relationships and predicting outcomes. With these essential functions, you’ll enhance your learning experience and tackle course challenges more effectively—there’s even more to explore!
Key Takeaways
- A reliable calculator simplifies both basic and advanced calculations, enhancing understanding of statistical concepts in AP Statistics.
- Graphing capabilities allow for effective data visualization, crucial for analyzing distributions and relationships between variables.
- Statistical functions enable quick computations of means, standard deviations, and hypothesis tests, streamlining data interpretation.
- Data analysis tools help summarize large datasets, create frequency tables, and find percentiles, transforming raw data into actionable insights.
- Regression tools facilitate linear and complex model analyses, calculating correlation coefficients and aiding in outcome predictions based on data.

When you tackle AP Statistics, having a reliable calculator can make all the difference. You’ll want a device that not only handles basic calculations but also excels in more advanced features. The right calculator can simplify complex problems, allowing you to focus on understanding concepts rather than getting bogged down in computations. Key features like graphing capabilities, statistical functions, data analysis tools, and regression tools will become your best friends as you navigate through the course.
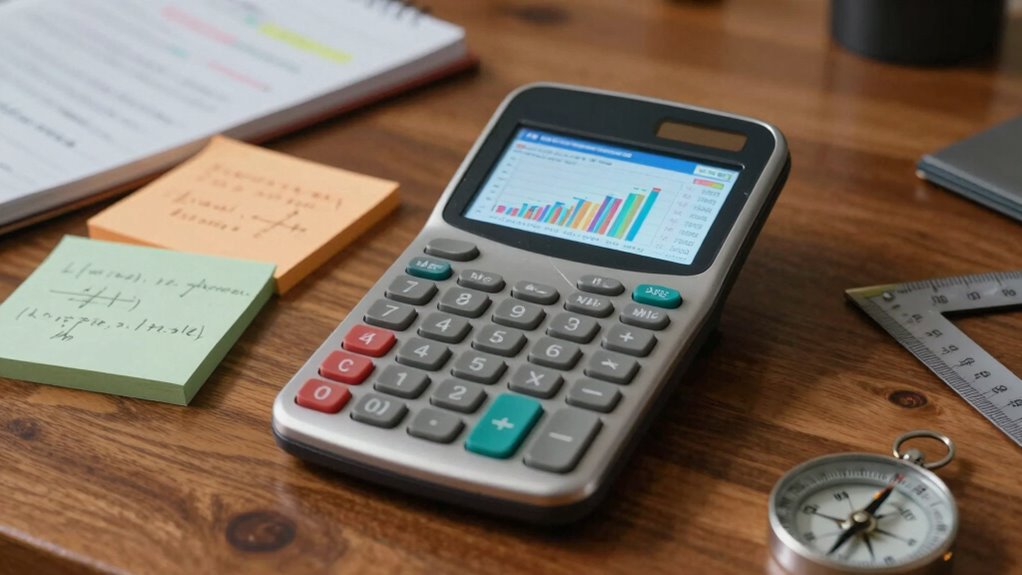
First off, let’s talk about graphing capabilities. A calculator with robust graphing features allows you to visualize data quickly and effectively. You’ll find it indispensable when working with distributions or exploring relationships between variables. By plotting data points and seeing trends on a graph, you can gain insights that numbers alone may not reveal. A good graphing calculator lets you adjust scales and view multiple graphs simultaneously, helping you analyze data from different perspectives.
Next, consider the statistical functions your calculator offers. You’ll need to perform a variety of statistical analyses, from calculating means and medians to finding standard deviations and conducting hypothesis tests. With the right statistical functions, you can easily compute these values, making it simpler to interpret your data. Make sure your calculator allows you to enter lists of numbers and perform one-variable and two-variable statistics, as this is essential for many of the problems you’ll face.
Data analysis is another significant area where a capable calculator shines. You’ll often need to summarize large datasets, and a good calculator can streamline this process. Look for features that allow you to sort data, find percentiles, and create frequency tables. With these tools at your disposal, you can turn raw data into meaningful information, which is crucial for drawing conclusions in statistics.
Lastly, regression tools are important for understanding relationships between variables. Whether you’re working on linear regression or more complex models, having a calculator that can perform these analyses will save you time and effort. You’ll appreciate the ability to fit a regression line to your data, calculate the correlation coefficient, and assess how well your model predicts outcomes.
graphing calculator for AP Statistics
As an affiliate, we earn on qualifying purchases.
As an affiliate, we earn on qualifying purchases.
Frequently Asked Questions
What Types of Calculators Are Allowed in AP Statistics Exams?
You can use graphing calculators with statistical functions on the AP Statistics exam. Make certain your calculator has the ability to handle data analysis, create graphs, and perform statistical calculations like regression and probability distributions. Brands like TI and Casio are popular choices, but check the College Board’s guidelines to confirm your specific model meets the requirements. You’ll want a device that enhances your ability to analyze and interpret statistical data effectively.
How Can I Practice Using My Calculator Effectively?
You might think mastering your calculator’s statistical functions is as easy as pie, but it’s not. To practice effectively, immerse yourself in those calculator shortcuts. Start by exploring each function; don’t just memorize them—understand how they help you solve problems. Work through practice problems and time yourself to simulate exam conditions. The more familiar you become, the less you’ll dread using your calculator when it counts. Remember, confidence comes with practice!
Are There Any Specific Calculator Models Recommended for AP Statistics?
For AP Statistics, you’ll find the TI-84 Plus and the Casio fx-9750GII highly recommended. These models excel in graphing, statistical calculations, and user-friendly interfaces. When you’re comparing models, consider their functionality in handling data sets and performing regressions. Both options offer great features, but the TI-84’s extensive online support can be a big help. Choose the one that fits your style, and you’ll be well-prepared for the exam!
What Should I Do if My Calculator Malfunctions During the Exam?
If your calculator malfunctions during the exam, stay calm. For instance, imagine your screen suddenly goes blank. First, try basic troubleshooting: reset it or check the battery. If that doesn’t work, raise your hand and ask for assistance. During exam preparation, practice these scenarios so you feel ready. Familiarize yourself with the calculator’s manual, too. Knowing what steps to take can save precious time and keep you focused on the questions.
Can I Use My Calculator for the Entire AP Statistics Exam?
Yes, you can use your calculator for most of the AP Statistics exam, but be aware of calculator limitations. It’s essential to know which functions are allowed and how to maximize your efficiency with it. Develop exam strategies that involve using your calculator for calculations but also practice doing some problems without it. This’ll guarantee you’re prepared for any questions where calculator use isn’t necessary or could slow you down.
scientific calculator with statistical functions
As an affiliate, we earn on qualifying purchases.
As an affiliate, we earn on qualifying purchases.
Conclusion
In AP Statistics, your calculator isn’t just a tool; it’s your trusty sidekick, ready to release a tidal wave of data analysis! With features like regression analysis and statistical tests, it transforms you into a statistical superhero, battling confusion and chaos with numbers. Imagine effortlessly crunching complex data like a wizard casting spells, revealing patterns hidden in plain sight. So, embrace these features, and watch your confidence soar as you conquer the world of statistics, one calculation at a time!
advanced graphing calculator for data analysis
As an affiliate, we earn on qualifying purchases.
As an affiliate, we earn on qualifying purchases.
statistics calculator with regression tools
As an affiliate, we earn on qualifying purchases.
As an affiliate, we earn on qualifying purchases.