When creating accessible data visualizations, you have an ethical responsibility to consider all users, including those with visual impairments or color vision deficiencies. You should use high contrast colors, clear fonts, and simple layouts to improve readability for everyone. Incorporating features like alternative text or auditory cues ensures inclusivity. Prioritizing accessibility not only fosters ethical presentation, but it also broadens your audience reach. To learn more about making your visualizations truly inclusive, keep exploring the best practices and tools available.
Key Takeaways
- Ethical data visualization requires prioritizing readability for all users, including those with visual impairments.
- Ensuring high contrast and clear fonts upholds inclusivity and prevents misinterpretation.
- Using accessible design principles demonstrates responsibility and respect for diverse audience needs.
- Incorporating alternative descriptions and testing across devices promotes fairness and transparency.
- Ongoing adherence to accessibility standards reflects a commitment to ethical, equitable data communication.
Data visualizations are powerful tools for communicating complex information quickly, but they often overlook the needs of all users. When designing visualizations, you must consider how every person will interpret the data, regardless of their visual abilities. Poor color contrast can make it difficult for users with visual impairments or color vision deficiencies to distinguish between different elements. High contrast between background and foreground colors ensures that your charts and graphs are easily readable, preventing accidental misinterpretation. For example, pairing dark text with a light background or vice versa can significantly improve clarity. Avoid subtle color differences that might seem distinct to you but are indistinguishable for someone with color blindness. Incorporating sound healing science principles, such as auditory cues or feedback, can provide additional layers of understanding for users with visual challenges. Equally important is font accessibility. When choosing fonts, you should prioritize readability over style. Opt for clear, simple typefaces like Arial, Verdana, or Tahoma, which are designed to be easy to read on screens. Keep font sizes large enough to be legible without zooming, especially for headings and key data points. Consistent font use throughout your visualization helps users quickly identify different sections and understand the structure. Additionally, avoid decorative or overly stylized fonts that can hinder readability, especially for users with dyslexia or visual impairments. Proper line spacing, sufficient contrast between text and background, and avoiding cluttered layouts all contribute to making your visualizations more accessible. Ensuring that your visualizations adhere to accessibility standards promotes inclusivity and enhances overall comprehension. Using contrast checkers during the design process can help identify potential issues early on. Recognizing that inclusive design benefits all users encourages a more thoughtful and ethical approach to data presentation. Remember, accessibility isn’t just about aesthetics; it’s an ethical obligation. You want your data to be understood by everyone, not just those with perfect vision. Incorporating universal design principles into your visualization process can further improve its inclusivity. Incorporate tools like color-blind filters or contrast checkers during the design process to identify potential issues. Test your visualizations on different devices and with different user groups when possible. Providing alternative text descriptions or data tables can also help users who rely on screen readers. These small adjustments can make a significant difference, ensuring your data is inclusive and ethically responsible.
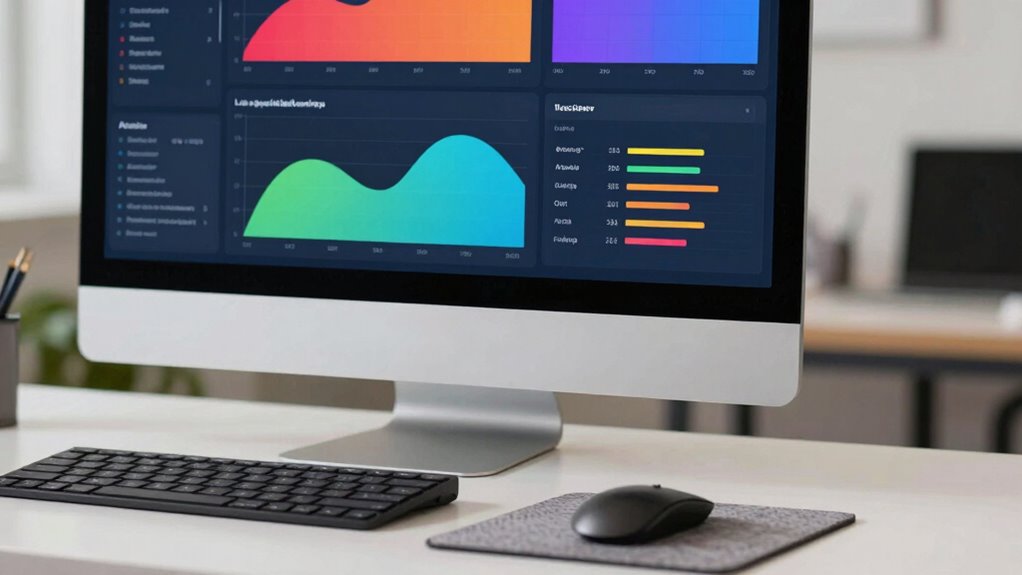
high contrast color palette for data visualization
As an affiliate, we earn on qualifying purchases.
As an affiliate, we earn on qualifying purchases.
Frequently Asked Questions
How Do Color Choices Impact Accessibility for Color-Blind Users?
Your color choices greatly impact accessibility for color-blind users by affecting color contrast and visual perception. You should select high-contrast colors and avoid relying solely on color differences, ensuring all users can distinguish data points clearly. Using patterns or labels alongside colors helps improve readability. By prioritizing accessible color contrast, you make your visualizations inclusive, allowing everyone to interpret the data accurately regardless of their visual perception limitations.
What Are the Best Tools for Creating Accessible Data Visualizations?
Think of your tools as a bridge to inclusivity. You should explore platforms like Tableau and Power BI for creating interactive dashboards that enhance engagement. Don’t forget to add alternative text to guarantee screen readers can interpret your visuals. These tools enable you to design accessible data visualizations, making your insights available to everyone, regardless of ability. By prioritizing usability, you foster transparency and trust in your data storytelling.
How Can Data Visualizations Be Tested for Accessibility?
You can test data visualizations for accessibility by guaranteeing they include clear alternative text that describes the visual content for screen readers. Additionally, verify keyboard navigation so users can interact with the visualization without a mouse. You might also use accessibility tools and screen readers to identify issues, making adjustments to improve readability and usability for all users. This process ensures your visualizations are inclusive and ethically sound.
What Are Common Mistakes That Hinder Readability in Charts?
You might drown in a sea of chart complexity, where too many data points or clutter obscure the message. Mistakes like poor label clarity act like fog, hiding essential details and confusing viewers. When you pack a chart with complex visuals or unclear labels, you turn readability into a maze. Simplify design, use clear labels, and keep focus sharp—these steps cut through chaos and guide your audience smoothly through the story.
How Does Accessibility Affect Data Interpretation Accuracy?
Accessibility greatly influences your ability to interpret data accurately. Inclusive design ensures visualizations are clear and usable for everyone, reducing misinterpretations. Ethical considerations emphasize your responsibility to present data transparently and fairly, preventing bias or confusion. When visualizations are accessible, you can trust the insights they offer, leading to better decision-making. Ignoring accessibility risks miscommunication, while prioritizing it enhances understanding and promotes ethical data sharing.
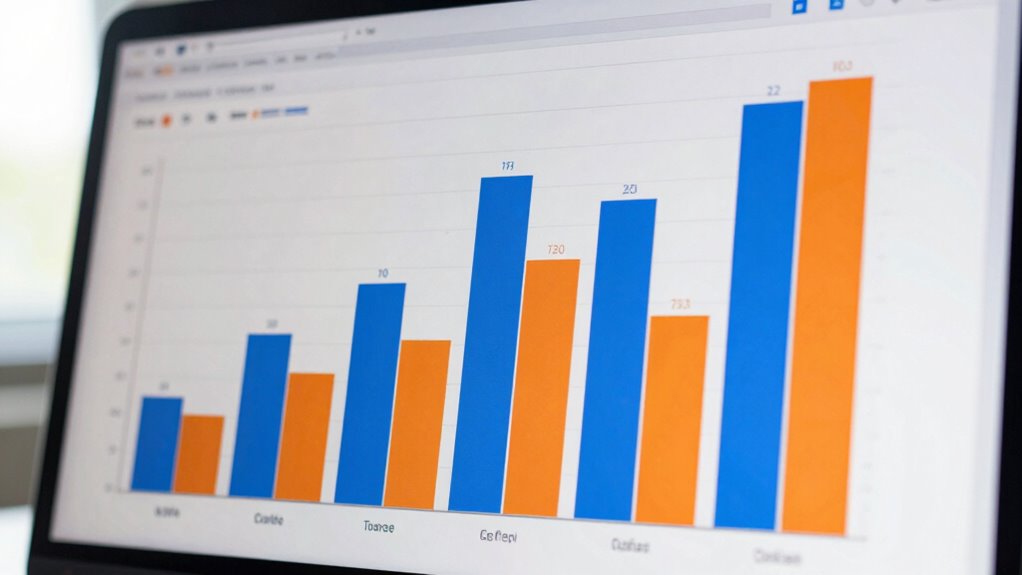
accessible font for screens
As an affiliate, we earn on qualifying purchases.
As an affiliate, we earn on qualifying purchases.
Conclusion
Imagine you’re designing a map for travelers with different needs—you’d guarantee roads are clear and signs easy to read. Similarly, making data visualizations accessible means crafting visuals that everyone can understand, regardless of ability. Just like a well-lit path guides a hiker through darkness, clear, readable visuals guide viewers to insights without confusion. By prioritizing accessibility, you’re not just sharing data—you’re opening doors to understanding for all, turning complex information into a shared journey.
color blindness test tool
As an affiliate, we earn on qualifying purchases.
As an affiliate, we earn on qualifying purchases.
screen reader compatible data visualization tools
As an affiliate, we earn on qualifying purchases.
As an affiliate, we earn on qualifying purchases.