
📊 Full opportunity report: Stenvrik: News as Geography on ThorstenMeyerAI.com — validation score, market gap, and execution plan.
TL;DR
Stenvrik launches a news platform that visualizes live stories pinned to 49 city hubs on a rotating 3D globe, emphasizing geographic context. It operates at minimal cost and also provides trend signals for broader content strategies. The platform is currently in closed beta.
Stenvrik has introduced a new news platform that visualizes live stories pinned to 49 city hubs on a rotating 3D globe, emphasizing geographic context over traditional list feeds. The platform aims to address the limitations of current news aggregation by focusing on where news is happening, which matters for understanding regional trends and global impacts. This development is significant for news consumers and publishers seeking more spatially aware information tools.
The platform organizes approximately 1,700 live stories across 49 city hubs on a dynamic 3D globe, enabling users to see what is breaking or developing in specific locations. Its core innovation is a trend engine that autonomously surfacing, clustering, and pinning stories to their respective cities, updating continuously without manual input. The system runs on client-side rendering, making it cost-efficient with an estimated monthly expense close to zero. This low-cost operation allows the platform to remain sustainable while providing real-time geographic insights. Beyond its consumer interface, the underlying trend engine supplies strategic signals to the broader publishing network. It detects regional interest surges and emerging topics, offering market intelligence that can inform coverage decisions, supply chain responses, or political analysis. This dual function transforms the platform from a simple visualization tool into a strategic asset for content operations, effectively turning geographic news into actionable data. Currently in closed beta, the platform’s interface and underlying engine are still subject to refinement, and its long-term impact remains to be seen.Stenvrik — news as geography
Not what is the news — where is it happening. ~1,700 live stories pinned to 49 city hubs on a rotating globe, with an autonomous trend engine that also feeds the network.
Spin the world; the news sorts itself.
A 60fps 3D globe where every story is pinned to the city it belongs to. Clusters, gaps, regions heating up — context a vertical feed throws away.
Independent commentary, produced with AI assistance under human editorial oversight. The views are the author’s own and may change. Stenvrik is in closed beta; features, availability, and behavior may change and it is provided without guarantee of uptime or fitness for a particular purpose. The autonomous trend engine clusters and places stories programmatically and may contain errors, mis-placements, or omissions — verify independently before relying on any of it. Product and company names are trademarks of their respective owners; mention does not imply endorsement.
Implications for News Consumption and Strategy
Stenvrik’s geographic news visualization offers a new way to interpret and act on real-time information, shifting focus from chronological lists to spatial awareness. For consumers, it provides immediate context about where news is happening, which can influence individual understanding of global events. For publishers and strategists, the trend detection capabilities embedded in the platform serve as early warning signals for regional shifts, market opportunities, or emerging crises, potentially shaping coverage priorities and resource allocation. Its low operational cost means it can be sustained and scaled without heavy infrastructure investment, making it a notable innovation in digital news tools.

Replogle Illuminated World Globe with Stand, 12 Inch diamteter light up globe with 3-D Raised Relief Texture. Perfect for Children And Kid's Classroom and home Decor, Made In USA
Illuminated Blue Ocean Globe
As an affiliate, we earn on qualifying purchases.
As an affiliate, we earn on qualifying purchases.
Evolution of News Interfaces and Geospatial Visualization
The current landscape of digital news is dominated by endless streams of headlines, often lacking spatial or contextual coherence. Traditional aggregation feeds prioritize recency over relevance or location, leading to information overload without geographic clarity. Previous attempts at visualizing news geographically have been limited or static, and many have struggled with cost or real-time accuracy. The emergence of Stenvrik responds to these gaps by integrating live story clustering with a 3D globe interface, inspired by the idea that ‘place is context.’ Its development was driven by the need for a more meaningful, location-aware news experience that can also serve as a strategic tool for publishers. The platform started as a simple demo, but its promising performance has led to its current closed beta phase, signaling a potential shift in how news is organized and consumed.
“By visualizing news geographically, we shift the question from ‘what’s new’ to ‘where is it happening,’ which is often more relevant for understanding the impact.”
— Thorsten Meyer, creator of Stenvrik

LeapFrog Magic Adventures Globe (Frustration Free Packaging)
Go beyond countries and their capitals using this enhanced globe with a 2.8” video screen that explores cultures,…
As an affiliate, we earn on qualifying purchases.
As an affiliate, we earn on qualifying purchases.
Unclear Aspects of Platform Adoption and Impact
It is not yet clear how widely the platform will be adopted once in open access or how it will influence user behavior over time. The long-term accuracy and relevance of the trend engine are still under evaluation, and its integration into larger news ecosystems remains uncertain. Additionally, questions remain about how publishers and media companies will leverage the geographic signals for commercial or editorial purposes, and whether the interface will evolve to support more complex analytics or user customization.
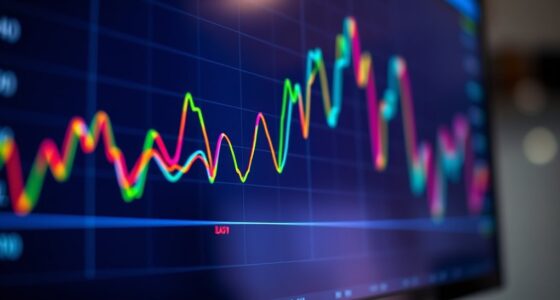
geographic news display monitor
As an affiliate, we earn on qualifying purchases.
As an affiliate, we earn on qualifying purchases.
Next Steps for Development and Wider Release
The platform is currently in closed beta, with plans to expand access to select partners and gather user feedback. Developers aim to refine the interface, improve trend detection accuracy, and explore integrations with existing newsroom tools. A broader public release is not yet scheduled, but if the platform demonstrates strong engagement and utility, it could influence future news consumption habits and strategic planning. Monitoring updates from the development team and early adopter feedback will be key to understanding its eventual impact.

Gulf of America- Replogle World Classic Globe, 12" Desktop World Globe For Home or Office Desk Decor, Raised Relief, Up-to-date Cartography, Made in the USA, Antique
– Approved cartography/ U.S. Mapping by U.S. State Departmen
As an affiliate, we earn on qualifying purchases.
As an affiliate, we earn on qualifying purchases.
Key Questions
How does Stenvrik’s globe interface improve news understanding?
The globe provides a spatial perspective, allowing users to see where news stories are happening in real time, which adds context and helps identify regional trends and hotspots.
Is the trend engine capable of predicting future news developments?
While primarily designed for clustering and detecting emerging topics, the engine’s signals can serve as early indicators of regional interest surges, but it does not explicitly predict future events.
Will this platform be available to the general public?
Currently, it is in closed beta with limited access. A wider release will depend on further testing, refinement, and strategic decisions by the developers.
How does the low cost of the platform affect its sustainability?
Because most of the processing occurs client-side and the trend engine runs on owned infrastructure, operational costs are minimal, enabling sustainable, long-term deployment without heavy infrastructure investment.
Source: ThorstenMeyerAI.com