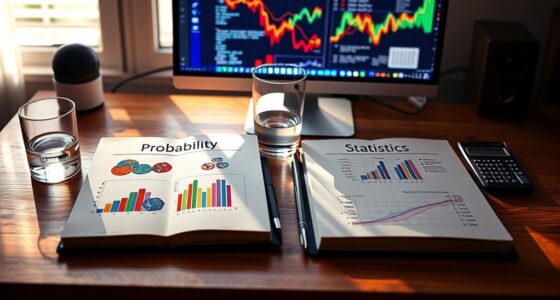

Range, variance, and standard deviation are key ways to measure how spread out your data is. The range shows the difference between the highest and lowest values, giving a quick overview but can be skewed by outliers. Variance and standard deviation go deeper, showing how much data points vary around the mean. Since outliers can influence these measures, understanding their impact helps you interpret your data accurately—if you want to learn more, keep exploring these concepts further.

Get business pricing on monitors, keyboards and dev gear
- Business-only prices and quantity discounts
- Tax-exempt purchasing
- Multiple users, one account, clear invoices
Key Takeaways
- Range measures the difference between the maximum and minimum values, providing a quick sense of data spread.
- Variance calculates the average squared deviations from the mean, indicating overall data variability.
- Standard deviation is the square root of variance, offering a more interpretable measure of spread in original units.
- All three metrics are sensitive to outliers, which can artificially inflate the perceived variability.
- Selecting the appropriate measure depends on data distribution and outlier presence for accurate analysis.
Have you ever wondered how to measure the spread or variability of a set of data? Understanding the extent to which data points vary helps you make better decisions, identify patterns, and assess the reliability of your data. One of the key ways to do this is through measures like range, variance, and standard deviation. These metrics provide different perspectives on how data points are dispersed around the central tendency, giving you a clearer picture of your dataset’s distribution shape and potential outliers detection.
The range is the simplest measure of spread. It’s calculated by subtracting the smallest value from the largest value in your data set. While quick and easy, the range is sensitive to outliers—extreme values that deviate *considerably* from other data points. Outliers detection becomes *vitally* important here because they can artificially inflate the range, giving a misleading impression of how spread out your data truly is. If your data has outliers, the range might suggest a much wider spread than what most data points exhibit. To get a more reliable sense of variability, especially when the distribution shape is skewed or contains outliers, you’ll want to look beyond just the range.
Variance and standard deviation take a *closer look* into data spread by considering how each data point differs from the mean. Variance measures the average squared deviation from the mean, effectively capturing how much the data points deviate overall. The standard deviation is simply the square root of the variance, bringing the measure back to the original units of your data for easier interpretation. These metrics are sensitive to outliers since extreme values can *substantially* increase the variance and standard deviation, *therefore* affecting your understanding of the data’s distribution shape. Recognizing this sensitivity helps you decide whether to use these measures or to *examine* other methods like median absolute deviation when outliers are present. Additionally, the integration of AI-powered processing in data analysis tools can enhance outlier detection and improve the accuracy of variability assessments.
Frequently Asked Questions
How Do I Choose the Best Measure of Spread for My Data?
You should choose the best measure of spread based on your data distribution and measurement suitability. For symmetrical distributions, standard deviation works well because it considers all data points. If your data is skewed or has outliers, the range might be more appropriate since it highlights the overall spread. Always consider the nature of your data to select the most relevant measure, ensuring your analysis accurately reflects the data’s variability.
Can These Measures Be Used for Categorical Data?
You can’t use Range, Variance, or Standard Deviation for categorical data because of categorical limitations. These measures rely on numerical calculations and assumptions of meaningful order or distance, which categorical data lack. Their measure applicability is limited to numerical or ordinal data. For categorical data, consider using mode or frequency distributions instead, as they better reflect the data’s nature without implying any numeric relationships.
How Do Outliers Affect Each of These Statistical Measures?
Outliers can profoundly skew your measures of spread, making data seem more variable than it truly is. They cause the range to widen, impact variance by increasing overall deviation, and inflate the standard deviation, reducing data robustness. This means your analysis might be misleading if outliers aren’t addressed. Recognizing their impact helps you interpret data more accurately, ensuring your conclusions are based on true patterns rather than anomalies.
Are There Software Tools to Automatically Calculate These Metrics?
Yes, many statistical software tools offer automated calculation of range, variance, and standard deviation. You can easily input your data, and the software will quickly compute these metrics, saving you time and reducing errors. Programs like Excel, R, SPSS, and Python libraries provide built-in functions for these calculations, making it simple to analyze data spread efficiently. This automation helps you focus on interpreting results rather than manual calculations.
What Is the Relationship Between Variance and Standard Deviation?
You might find it interesting that the relation between variance and standard deviation is quite direct: standard deviation is simply the square root of variance. This calculation helps you understand data spread more intuitively, as variance measures the average squared deviations, while the standard deviation brings that measure back to the original units. fundamentally, they’re closely linked, with the standard deviation providing a clearer picture of data variability.
Conclusion
As you grasp the concepts of range, variance, and standard deviation, you begin to see how data’s true story unfolds. Imagine uncovering hidden patterns and surprises lurking within the numbers, waiting to be revealed. With each measure, you get closer to understanding the full picture—yet, the story isn’t over. The next step awaits, promising even deeper insights into the spread, variability, and what lies beneath the surface of your data.
Fall Picks
fall essentials
As an affiliate, we earn on qualifying purchases.