For your thesis data analysis meeting, bring well-organized data files in various formats like Excel or CSV, along with backup copies. Carry visualizations such as charts and tables, clearly labeled for easy interpretation. Keep detailed notes, questions, and references handy to capture insights and challenges. Have a clear outline of your research goals and hypotheses ready, and maintain a positive, engaged attitude. If you keep exploring, you’ll find more ways to make your meeting productive.
Key Takeaways
- Organized data files in multiple formats with backups and version history for quick access and reference.
- Printed or digital copies of analysis results, charts, and visualizations for discussion.
- Notes, references, and methodology details to clarify techniques and data issues during the meeting.
- Clear research questions, hypotheses, and a list of challenges to guide discussion and problem-solving.
- Prepared attitude, active engagement, and basic understanding of concepts to facilitate productive communication.
When preparing for a thesis data analysis meeting, being well-organized can make a significant difference in how smoothly the session goes. You want to ensure that you have everything you need at your fingertips to facilitate productive discussion and efficient problem-solving. Start by bringing your data files, preferably in multiple formats like Excel, CSV, or your preferred statistical software output. Having these readily accessible allows you to quickly reference specific datasets or rerun analyses if needed. It’s also wise to have a version history or backup copies, so you don’t lose progress if technical issues arise.
Organize your data files in multiple formats and keep backups to ensure smooth, efficient analysis sessions.
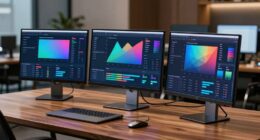
Next, prepare your analysis results, including key statistical methods and outputs. Bring printed or digital copies of your results, such as regression tables, descriptive statistics, or p-values. This helps you and your advisor review findings in detail and identify patterns or anomalies. If you’re using data visualization tools, prepare relevant charts and graphs beforehand. Effective data visualization can often reveal insights that raw numbers can’t, so having clear, well-labeled visuals on hand is essential. Whether it’s scatter plots, histograms, or box plots, visual representations make complex data more accessible and facilitate better interpretation.
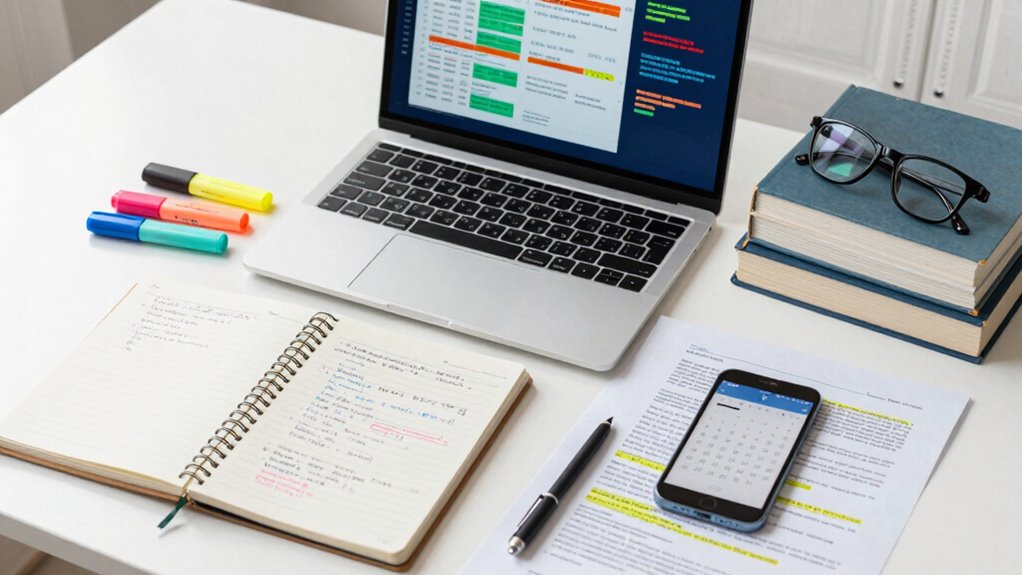
You should also bring a notebook or a digital device for note-taking. During the meeting, questions and ideas will likely come up, and capturing these in real-time ensures nothing gets overlooked. Jot down suggestions for refining your statistical methods or ideas for further analysis. If you’re planning to use specific statistical techniques, bring notes or references on how to implement them correctly, especially if you’re trying out advanced methods like multivariate analysis or time-series forecasting. Having these references on hand can save time and reduce errors during the discussion. Additionally, understanding data quality and its influence on your results can help you address potential issues more effectively, especially if you are aware of common data issues that may arise in your field. Recognizing the importance of data validation can further enhance your confidence in the results you present.
Don’t forget your research questions and hypotheses. Having a clear understanding of your objectives keeps the conversation focused and helps evaluate whether your current analysis aligns with your thesis goals. Bring a printed outline or summary of your research scope, so you can easily steer the discussion back to your main goals if it drifts. Additionally, consider bringing a list of challenges or uncertainties you encountered during analysis. This proactive approach helps your advisor understand where you need guidance and ensures the meeting addresses your most pressing concerns.
Finally, bring a positive attitude and readiness to learn. Even with all your prepared materials, the key to a successful thesis data analysis meeting is active engagement. Your preparedness, especially with data visualization and statistical methods, demonstrates your commitment to your research and makes the session more productive for everyone involved. Incorporating a basic understanding of contrast ratio and its impact on data clarity can further facilitate discussions about visualizations and presentation quality.
Excel data analysis USB drive
As an affiliate, we earn on qualifying purchases.
As an affiliate, we earn on qualifying purchases.
Frequently Asked Questions
How Should I Prepare My Data Before the Meeting?
You should prepare your data by ensuring proper data formatting, like cleaning and organizing your datasets for clarity and accuracy. Also, create visualizations to illustrate key findings, making complex information easier to interpret. Double-check all data points for consistency, and have your visualizations ready to discuss. This preparation helps you communicate your results effectively and demonstrates your thorough understanding during the meeting.
What Software or Tools Should I Bring?
For your data analysis meeting, bring powerful software like R, Python, or SPSS, which support data visualization and guarantee software compatibility. Prepare your tools to tackle tricky trends and visualize variables vividly. Double-check that your software is up-to-date and compatible with the systems you’ll use. Having these tools ready helps you handle hypotheses, interpret insights, and highlight your data’s story confidently and clearly.
Is It Necessary to Bring Printed Copies of Data?
Yes, it’s helpful to bring printed copies of data. Printing materials guarantees you have quick access to key data copies without relying solely on digital devices, especially if technical issues occur. Having physical data copies allows for easier annotation and discussion during the meeting. It also helps you stay organized and prepared to reference specific data points without interrupting the flow of the conversation.
Should I Bring a Laptop or Tablet?
Think of your device as your trusty compass—bringing a laptop or tablet guarantees you’re well-equipped for the data voyage. A laptop often offers more power, but a tablet can be more nimble for quick digital note-taking. Just make certain your device is compatible with the meeting’s software, so you can seamlessly access and analyze your data without hiccups. Either way, it’s your digital partner on this academic adventure.
How Do I Organize My Questions for the Meeting?
You should organize your questions by reviewing your literature review and research objectives first. Write down specific concerns or gaps you’ve identified and prioritize them. Group related questions together, which helps you stay focused and efficient. Bringing a clear list guarantees you don’t forget important points and allows for productive discussion. This organization demonstrates your understanding of the background and keeps the meeting focused on advancing your analysis.
digital notebook for note-taking
As an affiliate, we earn on qualifying purchases.
As an affiliate, we earn on qualifying purchases.
Conclusion
Think of your thesis data analysis meeting as a journey through a dense forest. Bring your compass—your prepared data and questions—to navigate confidently. With the right tools in hand, you can uncover hidden insights and clear the path forward. Remember, the more prepared you are, the smoother your trek. So pack wisely, stay curious, and embrace the adventure—your research’s true discovery awaits just beyond the next bend.
data visualization charts and graphs
As an affiliate, we earn on qualifying purchases.
As an affiliate, we earn on qualifying purchases.
backup external hard drive for data
As an affiliate, we earn on qualifying purchases.
As an affiliate, we earn on qualifying purchases.