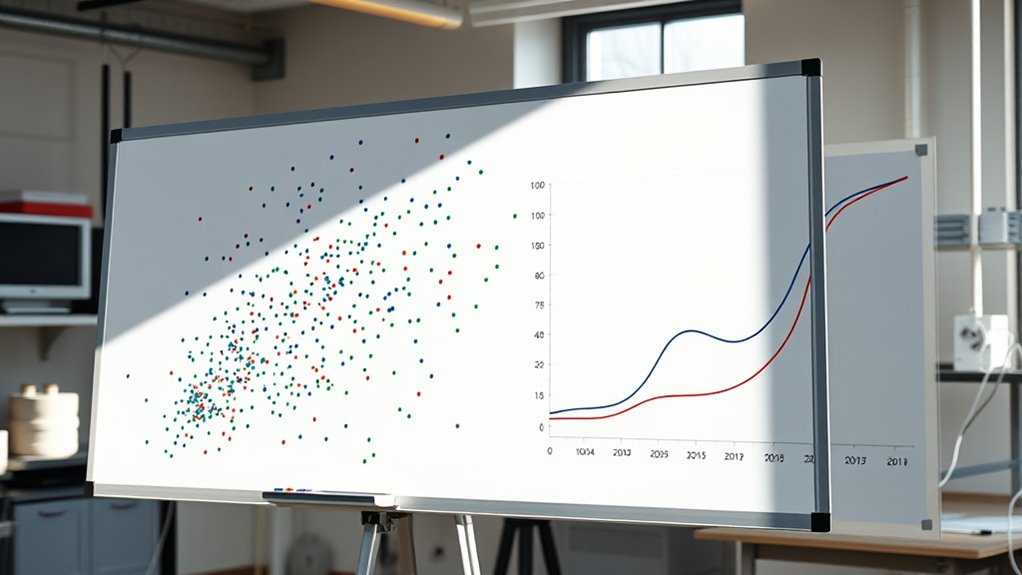

Scatter plots and line graphs are effective tools to visualize relationships between two variables. A scatter plot shows how data points are spread out, revealing patterns like positive or negative correlations, or no relationship at all. Line graphs connect data points over time, highlighting trends, stability, or significant changes. Mastering these visualizations helps you better interpret complex data. Keep exploring to discover more about how these graphs can reveal insightful data connections.
Key Takeaways
- Scatter plots display relationships between two variables, revealing trends, correlations, and patterns through point distribution.
- Line graphs connect data points over time or categories to show trends, stability, or significant changes.
- Look for overall directions (positive or negative) and clustering tightness to assess correlation strength.
- Random scatter indicates no relationship; clear patterns suggest meaningful connections between variables.
- Multiple lines on a graph facilitate comparison of different data sets or variables over the same scale.
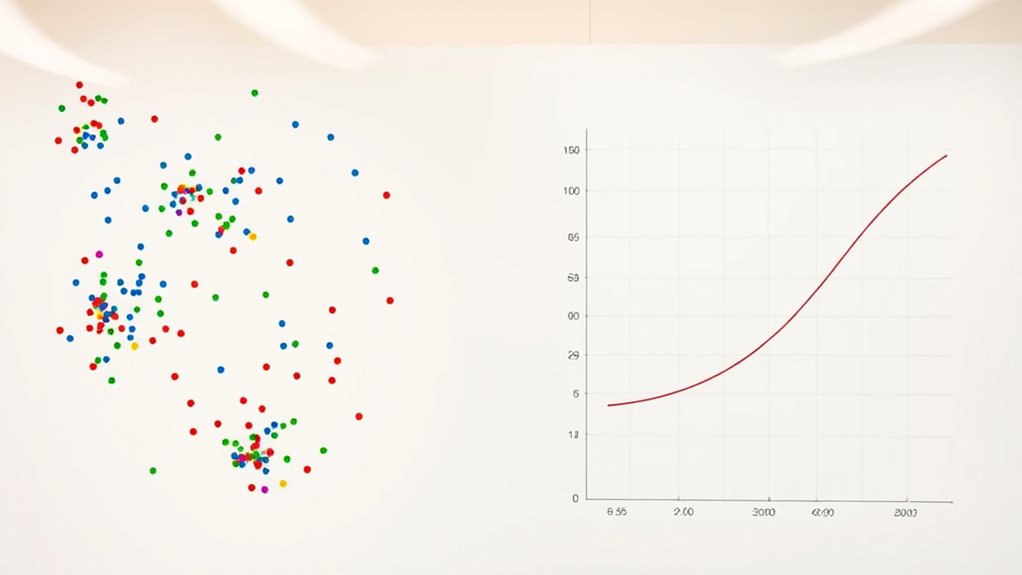
Scatter plots and line graphs are essential tools for visualizing data relationships and trends. When you’re analyzing two variables, these graphs help you see how they interact and whether there’s a pattern or connection. As you interpret the data, understanding correlation analysis becomes fundamental. Correlation analysis allows you to quantify the strength and direction of the relationship between variables, helping you determine if they move together positively, negatively, or not at all. Using scatter plots, you can quickly identify whether data points form a clear pattern, suggesting a strong correlation, or if they’re more dispersed, indicating a weak or no relationship. Line graphs, on the other hand, excel at showing how a variable changes over time or across categories, making trend interpretation straightforward. They enable you to see increases, decreases, or stability in data, which is essential for making informed decisions.
When creating a scatter plot, you plot one variable on the x-axis and the other on the y-axis. As you examine the plot, look for the overall direction of the points. If they tend to ascend from left to right, you’re seeing a positive correlation; if they descend, that’s a negative correlation. If the points are scattered randomly without a clear pattern, the variables likely lack a relationship. The strength of the correlation depends on how tightly the points cluster along a line. A tight cluster suggests a strong correlation, while a loose scatter indicates a weak one. For data trend interpretation, this visual cue helps you decide whether the relationship is meaningful or coincidental.
Line graphs simplify the process by connecting data points with lines, making it easy to observe trends over a period or across different groups. When analyzing a line graph, pay attention to the overall direction and consistency of the line. Sharp rises or falls can highlight significant changes, while a flat line indicates stability. If multiple lines are plotted, comparing their slopes can reveal relationships or differences between datasets. Both scatter plots and line graphs allow you to communicate your findings clearly, making complex data easier to understand at a glance.
Ultimately, mastering the use of these visual tools enhances your ability to perform correlation analysis and interpret data trends accurately. They turn raw numbers into visual stories, allowing you to spot patterns, relationships, and changes efficiently. Whether you’re making business decisions, conducting research, or exploring new data, these graphs are indispensable for turning complex information into actionable insights. With practice, you’ll become more confident in reading and creating these visuals, sharpening your data analysis skills and improving your overall understanding of the data’s story.
scatter plot graph paper
As an affiliate, we earn on qualifying purchases.
As an affiliate, we earn on qualifying purchases.
Frequently Asked Questions
How Do I Choose Between a Scatter Plot and a Line Graph?
To choose between a scatter plot and a line graph, consider the correlation patterns and what you want to emphasize. Use a scatter plot if you’re exploring relationships and correlations between two variables, as it offers visual clarity of data distribution. Opt for a line graph when showing trends over time or continuous data, making the pattern and progression clear. Your choice depends on what story you want your data to tell.
Can Scatter Plots Show Non-Linear Relationships Effectively?
Yes, scatter plots can effectively show non-linear relationships. They allow you to visualize complex patterns, curves, or clusters that linear models might miss. When data points form a clear curve or pattern, a scatter plot helps you identify these non-linear relationships. To enhance effectiveness, you might add trend lines or smoothers, making it easier to interpret how variables relate beyond straight-line assumptions.
What Are Common Mistakes When Interpreting These Graphs?
When interpreting scatter plots and line graphs, you often misinterpret correlation by assuming causation or overlooking non-linear patterns. Ignoring outliers can distort your understanding of the data’s true relationship, leading you to draw incorrect conclusions. Be cautious about these mistakes—examine the entire graph carefully, consider outliers’ impact, and remember that a strong correlation doesn’t always mean one variable causes another.
How Do I Add Trend Lines to My Scatter Plot?
To add a trend line to your scatter plot, first select your chart. Then, click on any data point to activate the chart tools. Look for the option labeled “Add Trend Line” or “Insert Trend Line” in the chart menu. Choose the type of trend line that best fits your data, such as linear or exponential. This line represents the best fit, helping you visualize the overall trend.
Are There Tools to Automate Creating These Visualizations?
Did you know that using automated visualization tools can save you hours? Yes, many graph creation tools now offer features to automatically generate scatter plots and line graphs, complete with trend lines and labels. These tools streamline the process, making it easy to analyze data quickly. Whether you’re using Excel, Google Sheets, or specialized software like Tableau, automation helps you create clear, professional visualizations effortlessly.
line graph chart template
As an affiliate, we earn on qualifying purchases.
As an affiliate, we earn on qualifying purchases.
Conclusion
Just as Da Vinci used lines and points to craft masterpieces, you now harness scatter plots and line graphs to reveal stories within your data. These tools serve as your brushes, painting clear pictures amid complexity. With practice, you’ll turn raw numbers into visual poetry that speaks volumes. Remember, every chart is a window—inviting you to explore, understand, and create insights that are as timeless as art itself.
bivariate data visualization tools
As an affiliate, we earn on qualifying purchases.
As an affiliate, we earn on qualifying purchases.
correlation analysis software
As an affiliate, we earn on qualifying purchases.
As an affiliate, we earn on qualifying purchases.