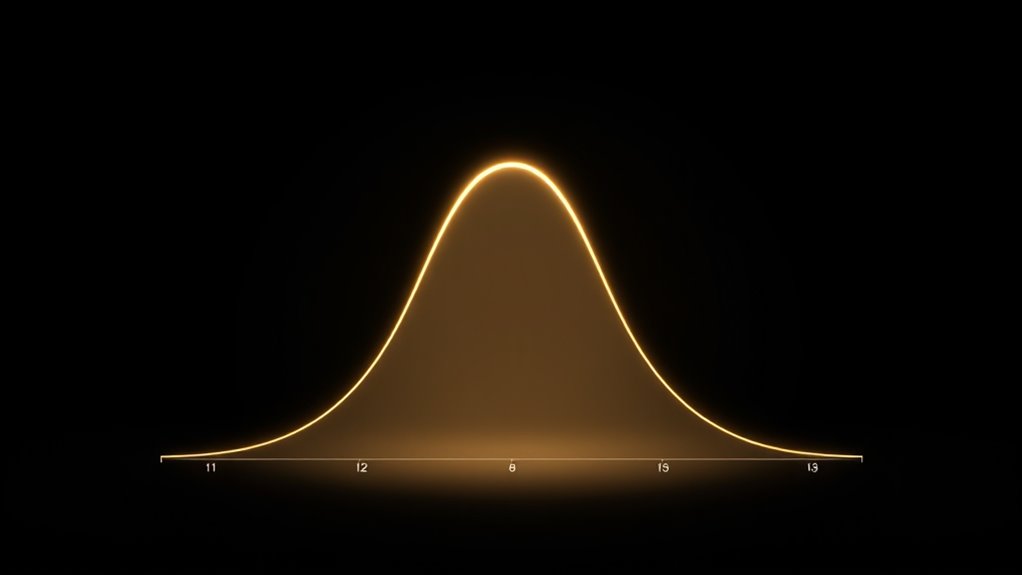

Understanding normal distributions helps you see how data clusters around a central value in a bell-shaped curve. The 68-95-99.7 rule shows that about 68% of data falls within one standard deviation, 95% within two, and nearly all (99.7%) within three. This helps you estimate probabilities and interpret data patterns quickly. If you want a clearer picture of how these concepts work together, there’s more to explore.

Get business pricing on monitors, keyboards and dev gear
- Business-only prices and quantity discounts
- Tax-exempt purchasing
- Multiple users, one account, clear invoices
Key Takeaways
- The 68-95-99 rule describes the percentage of data within 1, 2, and 3 standard deviations in a normal distribution.
- About 68% of data falls within 1 SD of the mean, indicating most data points are near the center.
- Approximately 95% of data is within 2 SDs, covering the majority of values in the distribution.
- Nearly 99.7% of data lies within 3 SDs, capturing almost all observed data points.
- This rule helps in estimating probabilities and understanding data variability in normal distributions.

A normal distribution is a common way to describe how data points are spread out around a central value, forming the familiar bell-shaped curve. This shape isn’t random; it reflects a specific pattern where most data points cluster near the mean, and fewer appear as you move further away. The key to understanding this pattern lies in the concept of standard deviation, which measures how spread out the data is from the average. The smaller the standard deviation, the tighter the data points are around the mean, creating a steeper bell curve. Conversely, a larger standard deviation results in a flatter, wider curve, indicating more variability in your data. When you visualize a bell curve, you’ll notice that the highest point sits at the mean, and the curve symmetrically tapers off on both sides. This symmetry is a hallmark of normal distributions and makes calculations and predictions more straightforward. Additionally, the shape of the normal distribution is fundamental in many areas of statistics and data analysis, especially in understanding data variability. Understanding the role of standard deviation in a bell curve is vital because it helps you interpret the distribution. For example, if you’re analyzing test scores and find that the standard deviation is small, most students scored close to the average. If it’s large, scores are more spread out, with some students performing much better or worse than average. The beauty of the normal distribution is its predictability: the 68-95-99 rule, also known as the empirical rule, leverages the properties of the bell curve to tell you how data is distributed. Specifically, about 68% of your data lies within one standard deviation of the mean, meaning it’s close to average. Extending this, approximately 95% of data falls within two standard deviations, covering most of the data points. Almost all, around 99.7%, will be within three standard deviations, capturing nearly all the data. This rule simplifies complex data analysis, allowing you to make quick estimates about the likelihood of certain outcomes. When your data follows a normal distribution, you can confidently state that most observations will be near the mean, with fewer occurrences at the extremes. Knowing about the bell curve and standard deviation, you can better understand patterns in your data, whether you’re evaluating test scores, measurement errors, or other continuous variables. The normal distribution’s predictability and the 68-95-99 rule give you powerful tools to interpret data efficiently and accurately, making it an essential concept in statistics.
Frequently Asked Questions
How Do I Identify if Data Follows a Normal Distribution?
You can tell if your data follows a normal distribution by analyzing its histogram, which should be bell-shaped and symmetric. Additionally, measure skewness; a value close to zero indicates symmetry typical of normal data. If the histogram is skewed or skewness is high or low, your data likely isn’t normal. These methods help you quickly assess whether your data approximates a normal distribution.
What Are Common Real-World Applications of the 68-95-99 Rule?
Think of the 68-95-99 rule as a map guiding you through real-world applications. In quality control, you use it to spot defects and maintain standards by understanding how measurements vary. In standardized testing, it helps you see how scores cluster around the average, ensuring fairness and consistency. By applying this rule, you confidently interpret data, identify anomalies, and improve processes effectively in these everyday scenarios.
How Does Skewness Affect the Normal Distribution?
Skewness impacts the distribution shape by making it asymmetrical rather than bell-shaped. When there’s positive skewness, the tail extends to the right, and with negative skewness, it stretches to the left. This affects how data values cluster around the mean, influencing your interpretation. Recognizing skewness helps you understand the distribution’s impact on statistical measures and guides you to make more accurate conclusions from the data.
Can the 68-95-99 Rule Be Applied to Non-Normal Data?
Think of the 68-95-99 rule as a delicate dance that thrives on the rhythm of normality. You can’t blindly apply it to non-normal data without robustness testing and distribution transformation. These steps help you identify whether the pattern can mimic a normal distribution. If the dance floor isn’t level, the rule loses its footing. Always test and transform your data first, ensuring the rule’s steps are valid for your dataset.
What Are Alternative Methods to Analyze Non-Normal Distributions?
You can analyze non-normal distributions using transformational techniques like log or square root transforms to make data more normal. If transformations don’t work, consider non-parametric tests such as the Mann-Whitney U or Kruskal-Wallis, which don’t assume normality. These methods help you accurately interpret data without relying on the normal distribution, giving you reliable insights even when data are skewed or irregular.
Conclusion
Understanding the 68-95-99 rule helps you see the beauty in how data naturally spreads out, like a gentle wave. By grasping this, you’re not just memorizing numbers—you’re revealing a powerful way to predict and interpret real-world patterns. So, embrace the magic of normal distributions, because they remind us that even chaos follows a rhythm, making sense of the seemingly random. With this knowledge, you’re better equipped to navigate the data-driven world around you.
Halloween Picks
halloween
As an affiliate, we earn on qualifying purchases.