

Geography spatial statistics helps you analyze how data points and patterns are spread across space and influence each other. It includes concepts like spatial autocorrelation, which shows whether similar values cluster together, and hotspot analysis, which identifies areas with high concentrations of features. These tools reveal meaningful spatial relationships that can inform decisions in areas like environmental management, urban planning, or public health. If you want to understand how to interpret these patterns, there’s much more to explore.
Key Takeaways
- Spatial statistics analyze geographic data patterns, emphasizing spatial autocorrelation and hotspot detection to reveal meaningful insights.
- Moran’s I and Geary’s C are key tests to measure whether similar values cluster or disperse across space.
- Hotspot analysis identifies areas with high feature concentrations, guiding targeted interventions and resource allocation.
- Understanding spatial relationships prevents treating data points as independent, improving model accuracy and interpretation.
- Mastering these concepts enhances decision-making in environmental, social, and infrastructural contexts through precise spatial insights.
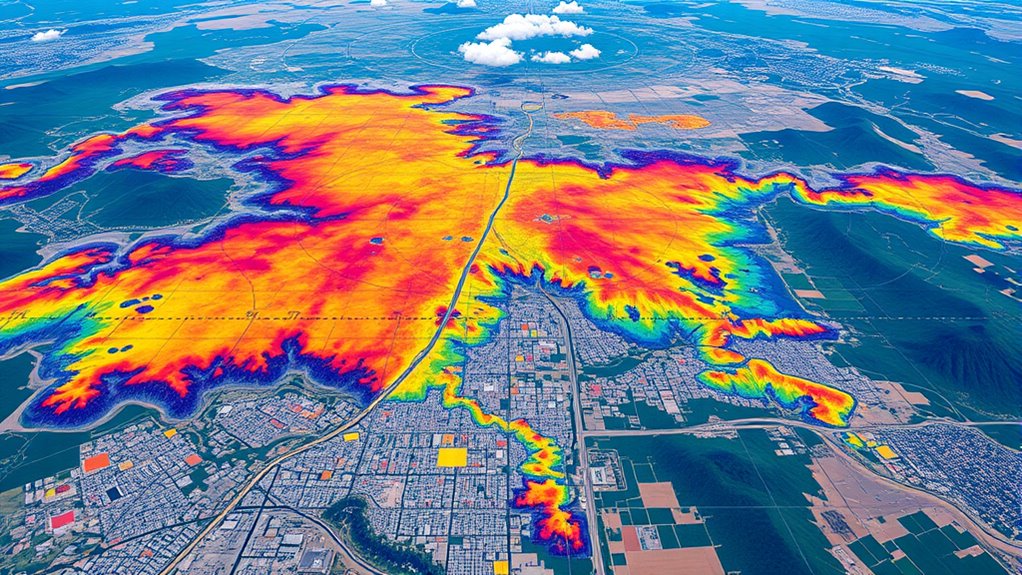
Geography spatial statistics is a branch of analysis that focuses on understanding the patterns and relationships of geographic data across space. When you immerse yourself in this field, you’ll quickly see how significant concepts like spatial autocorrelation and hotspot analysis are for uncovering meaningful insights. Spatial autocorrelation measures whether similar values tend to occur near each other. For example, if high crime rates cluster in certain neighborhoods, spatial autocorrelation confirms that these areas are not randomly distributed but are spatially linked. Recognizing these patterns helps you determine if observed trends are statistically significant or just due to chance. Hotspot analysis takes this a step further by pinpointing specific areas with high concentrations of a particular feature, such as disease outbreaks, pollution, or crime. It enables you to identify “hot” zones that require targeted interventions, making it a powerful tool for decision-making.
When you apply spatial autocorrelation, you use statistical tests like Moran’s I or Geary’s C to assess the degree of spatial clustering. A significant positive autocorrelation indicates that similar values are spatially grouped, while negative autocorrelation suggests a dispersed pattern. This step is vital because it guides your understanding of whether your data exhibits meaningful spatial structures or if the observed patterns could be random. Hotspot analysis, on the other hand, involves techniques like the Getis-Ord Gi* statistic, which determines whether high or low values are clustered within a specific area. It helps you visualize and prioritize regions that demand attention, whether for public health, urban planning, or resource allocation.
Both methods emphasize the importance of spatial relationships in geographic data. They help you avoid the mistake of treating spatial data as independent points, which can lead to misleading conclusions. Instead, these tools highlight how data points influence one another across space, revealing underlying processes or factors. Additionally, understanding the role of spatial autocorrelation improves the accuracy of your models and predictions. As you work with these techniques, you’ll learn to interpret the results within the context of your specific study area, considering local factors that might drive the patterns you observe. Whether you’re analyzing environmental risks, social issues, or infrastructure needs, understanding spatial autocorrelation and hotspot analysis allows you to make more informed, precise decisions based on spatial patterns. Mastering these concepts is essential for anyone looking to harness the full potential of geographic data and turn complex spatial information into actionable insights.
Top picks for "geography spatial statistic"
Open Amazon search results for this keyword.
As an affiliate, we earn on qualifying purchases.
Frequently Asked Questions
How Does Spatial Autocorrelation Influence Geographic Data Analysis?
Spatial autocorrelation affects your geographic data analysis by revealing spatial dependence, where nearby locations tend to influence each other. This impacts clustering analysis, as it highlights patterns like hotspots or cold spots. Recognizing spatial autocorrelation guarantees you don’t misinterpret random variation as meaningful clusters, allowing for more accurate insights. Ignoring it could lead to flawed conclusions, so you need to account for this spatial dependence when analyzing geographic data.
What Are the Best Software Tools for Spatial Statistics?
Imagine uncovering hidden patterns in your geographic data—what tools would you trust? You should explore GIS software like ArcGIS and QGIS, renowned for their powerful spatial analysis tools. These programs let you dive deep into spatial statistics, revealing insights that others might miss. Whether you’re mapping, analyzing autocorrelation, or modeling spatial relationships, these tools are your best allies for accurate, efficient geographic data analysis.
How Can Spatial Statistics Improve Urban Planning Decisions?
Spatial statistics help you improve urban planning decisions by analyzing patterns of urban growth and crime mapping. You can identify hotspots, predict future development areas, and allocate resources efficiently. This data-driven approach allows you to create safer, more sustainable cities by understanding spatial trends. With these insights, you make informed choices that enhance community well-being and urban resilience, ultimately shaping smarter, more responsive urban environments.
What Challenges Exist When Collecting Spatial Data?
When collecting spatial data, you face challenges like ensuring data privacy and maintaining data accuracy. You must protect sensitive information from misuse while gathering precise location details. Data accuracy can be compromised by errors in data entry or outdated sources. Balancing privacy concerns with the need for reliable, detailed data requires careful planning and the use of secure methods, so your spatial analysis remains trustworthy and ethically sound.
How Do Spatial Statistics Differ From Traditional Statistical Methods?
You’ll find that spatial statistics differ from traditional methods by focusing on spatial clustering and geographic modeling. Instead of analyzing data points in isolation, it considers how locations relate and interact across space. This approach reveals patterns and dependencies that traditional statistics might miss, helping you better understand geographic phenomena. Spatial statistics emphasize the importance of location, making your analysis more accurate and insightful for spatially distributed data.
Conclusion
So, now you know the nuances of geography and spatial statistics. By blending basic principles with bold breakthroughs, you build a better understanding of spatial patterns. Whether you’re analyzing areas or evaluating arrangements, mastering these methods makes your insights sharper. Stay curious, stay clever, and keep exploring the endless edges of spatial statistics. With confidence and curiosity, you can confidently chart, change, and challenge the characteristics of your chosen landscapes.