
TL;DR

Get business pricing on monitors, keyboards and dev gear
- Business-only prices and quantity discounts
- Tax-exempt purchasing
- Multiple users, one account, clear invoices
A new project uses deck.gl to visualize London trains in 3D, enabling users to track trains in real-time across the city and to airports. The tool integrates TFL and National Rail data for enhanced tracking.
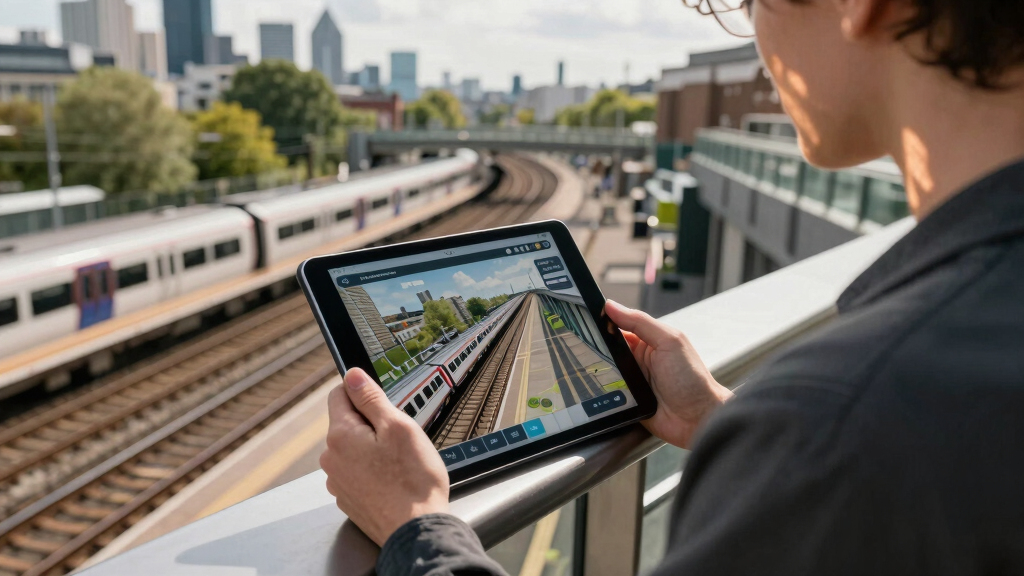
A developer has introduced a 3D visualization tool for tracking London trains in real-time, using the deck.gl library and data from the TFL API and National Rail. The tool allows users to follow trains along their routes with minimal drift, from platforms across London to airports, providing a new way to monitor transit movements.
The project is built on deck.gl, an open-source WebGL framework for large-scale data visualization. It pulls live data from the Transport for London (TFL) API and National Rail Enquiries, combining them to create a dynamic, three-dimensional map of train movements across London. Users can select any train departing from a platform and see its real-time position, route, and estimated arrival times, with the visualization updating continuously.
The developer stated that the tool aims to improve transit awareness for commuters and enthusiasts, providing a more immersive experience than traditional 2D maps. It also offers tracking to airports, helping travelers plan connections and departure times more accurately. The project is currently in a testing phase, with some features still being refined to minimize positional drift and improve accuracy.
Potential Impact on London Transit Monitoring
This visualization project demonstrates how open data and advanced web graphics can enhance real-time transit tracking, potentially influencing future transit apps and passenger information systems. It offers a more intuitive way to understand train movements, which could improve commuter experience and reduce congestion by providing better route awareness. Additionally, it may inspire similar projects in other cities seeking to modernize their transit data presentation.
As an affiliate, we earn on qualifying purchases.
Background on London Train Data and Visualization Efforts
London’s transit system has long offered real-time train tracking through official apps and websites, primarily in 2D formats. The TFL API provides live data on train locations, but visualizations are often limited to simple maps or text-based updates. The use of WebGL-based libraries like deck.gl for 3D visualization is relatively new in this context, with developers exploring more immersive ways to display transit data. This project builds on recent trends toward open, customizable transit tools, leveraging publicly available APIs and open-source graphics frameworks.
“This project aims to bring a new dimension to train tracking, making it more engaging and easier to understand at a glance.”
— Developer of the tool
As an affiliate, we earn on qualifying purchases.
Limitations and Data Accuracy Challenges
It is not yet clear how accurately the visualization minimizes positional drift over time or how well it handles data inconsistencies from TFL and National Rail. The developer mentioned ongoing refinements, but the current reliability and scalability of the tool remain to be fully tested in live conditions.
As an affiliate, we earn on qualifying purchases.
Upcoming Testing and Feature Enhancements
The developer plans to expand testing, improve data synchronization, and add features like route overlays and delay notifications. Further integration with other transit data sources and user feedback will guide future updates. A public beta release is expected soon, allowing users to try the visualization in real-world scenarios.
As an affiliate, we earn on qualifying purchases.
Key Questions
How does the 3D train visualizer work?
The visualizer uses deck.gl to render a three-dimensional map, pulling live train data from TFL and National Rail APIs to display train positions and routes dynamically.
Is this tool officially supported by TFL?
No, it is a third-party project created by an independent developer. However, it uses publicly available TFL data with their API support.
Can I use this to plan my commute?
Yes, the tool aims to provide real-time train tracking, which could help with journey planning, especially for airport connections and peak travel times.
What are the main limitations right now?
The accuracy of train positions and the handling of data inconsistencies are still being improved. The visualization may occasionally show drift or outdated information during testing.
Source: hn
Fall Picks
fall essentials
As an affiliate, we earn on qualifying purchases.