
To print charts and graphs without ruining the colors, start by ensuring your devices are properly calibrated for consistent color. Use quality printing techniques and select the right paper type—glossy for vibrancy or matte for subtlety. Always test print a small section to catch any discrepancies before finalizing. Pay attention to color profiles that match your printer. With these steps, you can enhance your visuals effectively and achieve the accuracy you need. There’s more to discover!
Key Takeaways
- Calibrate Devices: Ensure your monitor and printer are calibrated for consistent color representation before printing charts and graphs.
- Select Appropriate Paper: Use glossy paper for vibrant colors or matte paper for a muted effect, depending on your presentation needs.
- Utilize Best Quality Settings: Always print using the highest quality settings available on your printer for optimal color fidelity.
- Conduct Test Prints: Print a small test portion of your chart to preview colors and make necessary adjustments before final printing.
- Leverage Software Tools: Use specialized software with color simulation features to manage and preview colors effectively before printing.
Printing charts and graphs can enhance your presentations and reports, making data easier to understand. However, if you don’t manage the colors effectively, your visuals could end up looking dull or inconsistent. To avoid this, you need to focus on chart color management and the right printing techniques. Start by selecting a color palette that’s visually appealing and easy to interpret. Stick to a limited range of colors to maintain clarity; too many colors can confuse your audience.
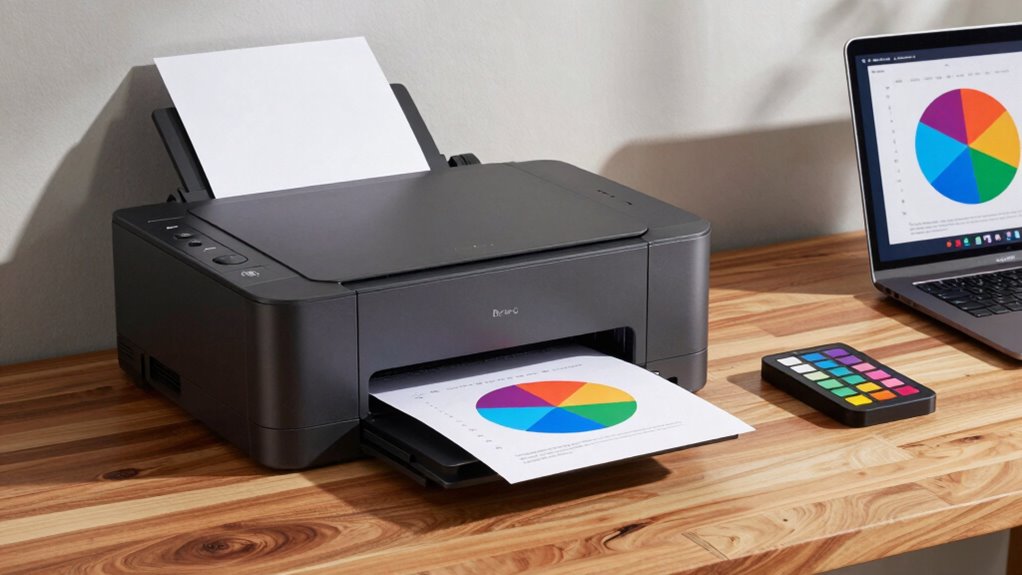
Before printing, verify that your colors are consistent across different devices. Colors can appear differently on screens than they do on paper, so it’s essential to calibrate your monitor and printer. You might want to take into account using color profiles that match your printer’s specifications. This step helps guarantee that what you see on your screen closely matches what comes out of the printer. Color management is crucial to ensure color accuracy and consistency. Additionally, understanding how different printing techniques impact color fidelity can make a significant difference in the final appearance.
When it comes to printing techniques, laser printers tend to produce sharper and more vibrant colors compared to inkjet printers. However, if you’re using an inkjet, high-quality photo paper can help enhance color depth and richness. Don’t forget to use the printer’s best quality settings; it may take longer, but the results are worth it.
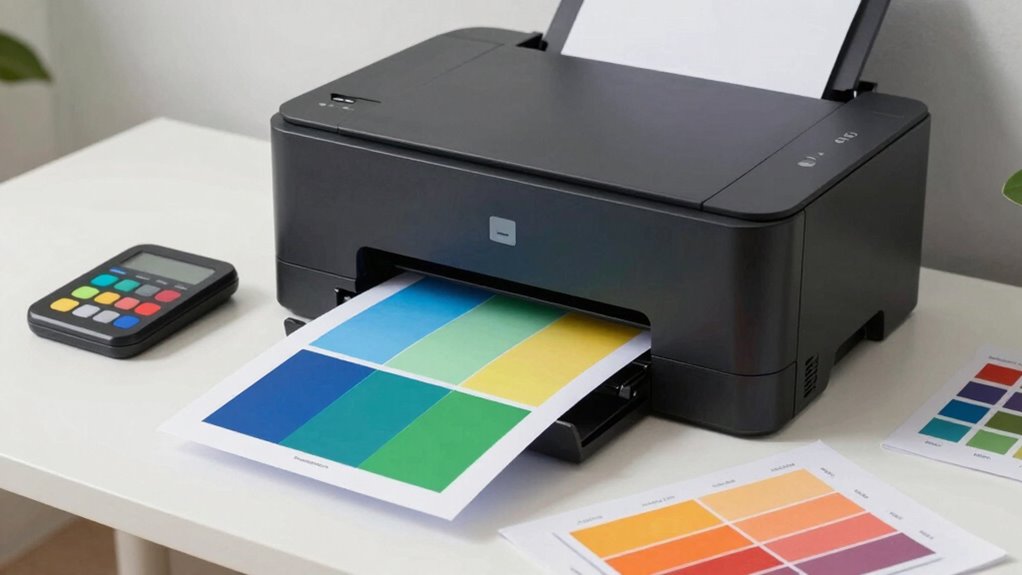
Once you’ve set your colors and chosen your printing method, test print a small portion of your chart or graph. This will give you a preview of how the colors will look on paper and allow you to make any necessary adjustments before the final print. If you notice any discrepancies, revisit your color management settings and tweak them accordingly. Color consistency across devices is crucial to ensure your printed visuals match your on-screen design.
Also, be mindful of the paper type. Glossy paper can make colors pop, while matte paper tends to absorb more ink, possibly muting the colors. Reflect on the context of your presentation. If you’re presenting in a brightly lit room, glossy paper might be a better choice to guarantee visibility.
Lastly, think about using software that specializes in printing charts and graphs. Many applications have built-in tools for color management, which can simplify the process. They often offer features that allow you to simulate how colors will look when printed, giving you more control over the final product. By following these tips, you’ll be well on your way to printing charts and graphs that truly engage your audience.
professional color calibration tool for printers
As an affiliate, we earn on qualifying purchases.
As an affiliate, we earn on qualifying purchases.
Frequently Asked Questions
What Paper Types Best Preserve Colors When Printing?
To best preserve colors when printing, use glossy paper for vibrant images and matte paper for a more subdued finish. Premium cardstock offers durability and excellent color reproduction. If you’re using recycled paper, check its inkjet compatibility to verify quality. For laser printers, select the appropriate print settings that match your color profiles. Experiment with different types to see which gives you the results you’re aiming for, enhancing your charts and graphs effectively.
How Can I Test Print Colors Before Finalizing?
Before you plunge into final prints, think of your colors as a painter’s palette, waiting for the perfect brushstroke. Start by color calibrating your printer and monitor to guarantee they speak the same language. Then, create test prints using different paper types. Observe how hues shift and adjust accordingly. This way, you’ll catch any discrepancies before your masterpiece hits the final canvas, making sure your colors shine just as you envisioned.
Are There Specific Printers Known for Better Color Accuracy?
Yes, some printers are renowned for better color accuracy. Look for models that utilize advanced color calibration techniques and high-quality printer dye types. Brands like Canon and Epson often lead in this area, providing superior color reproduction. Before you invest, check user reviews and professional comparisons to guarantee the printer meets your specific needs. Remember, even the best printer can underperform without proper setup and calibration, so pay attention to that, too!
Can I Adjust Color Settings in My Software?
Yes, you can adjust color settings in your software. Start by exploring your software preferences for color calibration options. Many applications let you fine-tune hues, saturation, and brightness to better match your desired output. Make certain to check the color profiles to guarantee accuracy. Experiment with these settings to see how they affect your charts and graphs, and don’t forget to print test pages to find the perfect balance.
What Common Mistakes Should I Avoid When Printing?
Did you know that nearly 30% of printing errors stem from improper setup? To avoid common mistakes, follow color calibration tips closely and guarantee your printer’s settings match your software. Regular printer maintenance practices are essential too; clean the print heads and check ink levels before printing. Always use high-quality paper to enhance color accuracy. With these steps, you’ll produce vibrant charts and graphs without the frustration of unexpected color shifts.
high quality glossy photo paper for printing charts
As an affiliate, we earn on qualifying purchases.
As an affiliate, we earn on qualifying purchases.
Conclusion
Printing charts and graphs doesn’t have to lead to dull colors or frustrating results. By using the right settings and quality paper, you can maintain the vibrancy of your visuals. Sure, it might seem intimidating at first, but with just a little practice, you’ll be able to create stunning prints that accurately represent your data. Don’t shy away from experimenting—your charts deserve to shine just as brightly on paper as they do on screen!
best printer for color accuracy and detailed graphs
As an affiliate, we earn on qualifying purchases.
As an affiliate, we earn on qualifying purchases.
color management software for printing visuals
As an affiliate, we earn on qualifying purchases.
As an affiliate, we earn on qualifying purchases.