
Google Sheets is a free, user-friendly tool perfect for simple statistical analysis. It allows you to easily visualize data with charts and graphs, making trends and patterns clear. You can quickly perform basic statistics like calculating averages or identifying outliers. Its accessible design works on any device with internet, helping you analyze sales, survey results, or other datasets efficiently. Keep exploring to discover how you can turn raw data into meaningful insights.
Key Takeaways
- Google Sheets is a free, user-friendly platform suitable for basic statistical analysis without costly software.
- It offers easy-to-use data visualization tools like charts and graphs to illustrate statistical findings.
- Trend analysis features, such as trendlines and data plotting over time, help identify patterns and shifts.
- The platform simplifies calculations of averages, medians, and other basic statistics for quick insights.
- Its educational support promotes understanding of statistical concepts and enhances data interpretation skills.
Are you looking for an easy way to perform basic statistical analysis without advanced software? Google Sheets offers a straightforward solution that’s accessible, free, and powerful enough for many common analytical tasks. Whether you’re analyzing sales data, survey results, or any other dataset, Google Sheets provides tools for data visualization and trend analysis that can help you uncover insights quickly. You don’t need to be a data scientist to start interpreting your data effectively—Google Sheets makes it simple.
Google Sheets makes basic data analysis simple, free, and accessible for everyone.
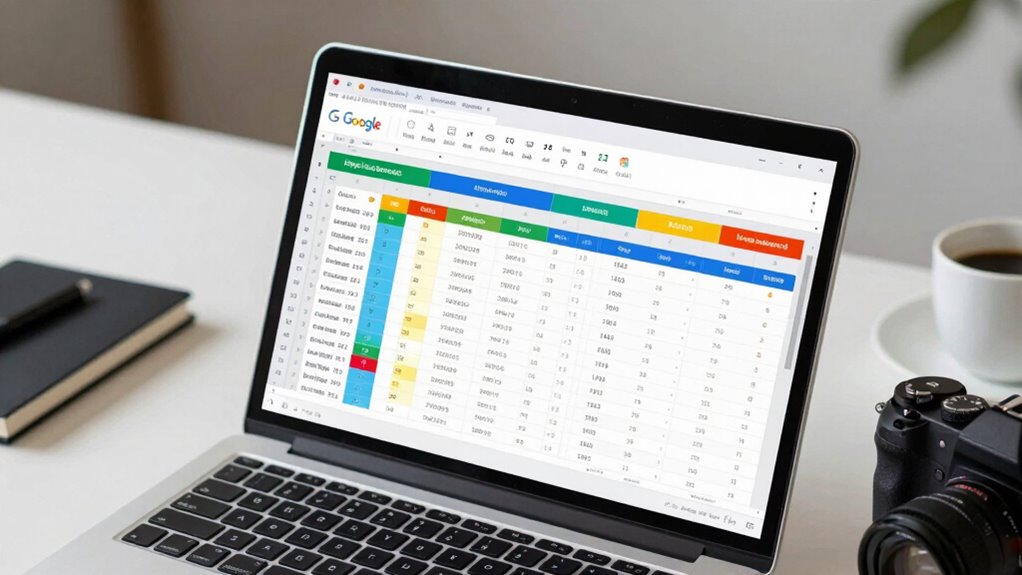
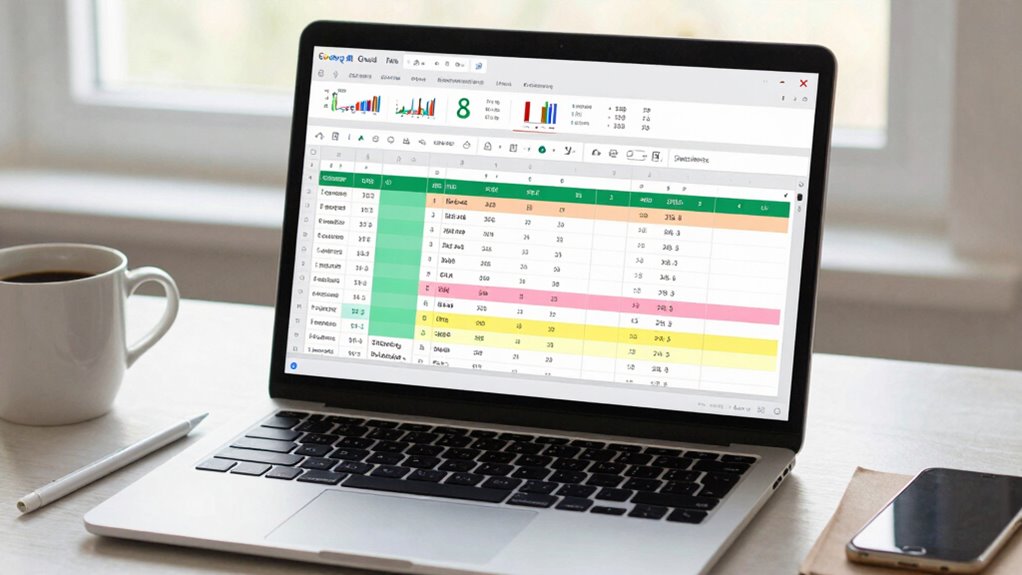
With Google Sheets, you can create visual representations of your data through charts and graphs. Data visualization is essential because it transforms raw numbers into easily understandable images, allowing you to spot patterns and outliers at a glance. You can generate bar charts, line graphs, scatter plots, and pie charts with just a few clicks. These visual tools help you communicate your findings clearly, whether you’re presenting to colleagues or making decisions on your own. The process is intuitive, and you can customize colors, labels, and axes to best suit your dataset.
Trend analysis is another key feature you’ll find useful in Google Sheets. By plotting your data points over time or categories, you can identify upward or downward trends that might otherwise go unnoticed. For example, a simple line chart can reveal seasonal fluctuations in sales or shifts in customer preferences. You can also add trendlines directly to your charts, which help quantify the overall direction of your data. This feature is particularly helpful for forecasting and making informed projections, all without the need for complex statistical software. Additionally, understanding statistical concepts can enhance your ability to interpret the results more effectively.
Google Sheets data visualization tools
As an affiliate, we earn on qualifying purchases.
As an affiliate, we earn on qualifying purchases.
Frequently Asked Questions
Can Google Sheets Handle Large Datasets Efficiently?
Google Sheets can handle large datasets, but its efficiency depends on your dataset size and complexity. As you work with bigger data, you need to perform data cleaning and data validation to prevent errors and slowdowns. Regularly optimize your sheets by removing unnecessary formulas and using efficient functions. For very large datasets, consider splitting data or using specialized tools, but for moderate sizes, Sheets remains a practical option.
How Do I Automate Statistical Analysis in Google Sheets?
Imagine a well-oiled machine—your Google Sheets. To automate statistical analysis, set up data validation rules to guarantee clean input, then streamline your work with formula optimization. Use ARRAYFORMULA to apply calculations across large datasets effortlessly. Incorporate custom scripts with Google Apps Script for advanced automation. By combining these techniques, you turn your spreadsheet into a powerful, self-sufficient tool that handles analysis with minimal manual effort.
Are There Advanced Statistical Functions Available in Google Sheets?
Yes, Google Sheets offers advanced statistical functions like LINEST, LOGEST, and FORECAST, which help you analyze data more deeply. You can perform data cleaning with functions like TRIM, CLEAN, and FILTER, ensuring your data is accurate. Additionally, you can customize functions using Apps Script, allowing you to tailor statistical analyses to your specific needs, making your analysis more precise and efficient.
How Secure Is My Data When Using Google Sheets for Analysis?
Your data in Google Sheets benefits from robust security measures, including data encryption during transmission and storage, which keeps your information protected from prying eyes. Access controls let you decide who can view or edit your sheets, giving you peace of mind. While no system is perfect, Google continuously updates its security features, so your data remains relatively secure when you follow best practices for sharing and access management.
Can I Visualize Statistical Results Directly Within Google Sheets?
Yes, you can visualize statistical results directly within Google Sheets. It offers data visualization options like creating charts and graphs from your data. You can customize these visuals with chart customization features, adjusting colors, labels, and styles to suit your needs. This makes it easy to interpret your statistical results visually, helping you communicate insights more effectively without needing external tools.
best statistical analysis software for beginners
As an affiliate, we earn on qualifying purchases.
As an affiliate, we earn on qualifying purchases.
Conclusion
Now that you’ve explored how Google Sheets makes simple statistical analysis easy, you’re like a skilled navigator steering through data waters. With just a few clicks, you can uncover insights and make informed decisions, all within a familiar spreadsheet. Think of it as a trusty compass guiding you through the data jungle. So go ahead, experiment and analyze—your data journey is just beginning, and Google Sheets is your reliable map.
charts and graphs for Google Sheets
As an affiliate, we earn on qualifying purchases.
As an affiliate, we earn on qualifying purchases.
trendline add-on for Google Sheets
As an affiliate, we earn on qualifying purchases.
As an affiliate, we earn on qualifying purchases.