
Oceanography statistics help you understand the complex world beneath the waves by turning raw data into clear visuals like maps and graphs. These tools display essential information such as temperature, salinity, and marine life health, making it easier for you to see patterns and trends. With advanced techniques and visualization, you gain insights into ocean health and climate impacts. Keep exploring to discover how these tools empower marine conservation and scientific progress.
Key Takeaways
- Marine sampling techniques provide accurate physical, chemical, and biological data essential for oceanographic statistics.
- Data visualization tools transform raw marine data into interpretable visuals like maps and graphs for better analysis.
- Oceanography statistics help identify trends such as rising sea surface temperatures and changes in ocean chemistry.
- Advanced technology enhances data collection and visualization, improving understanding of marine ecosystems and climate impacts.
- Effective interpretation of marine data supports decision-making for conservation, resource management, and climate change mitigation.
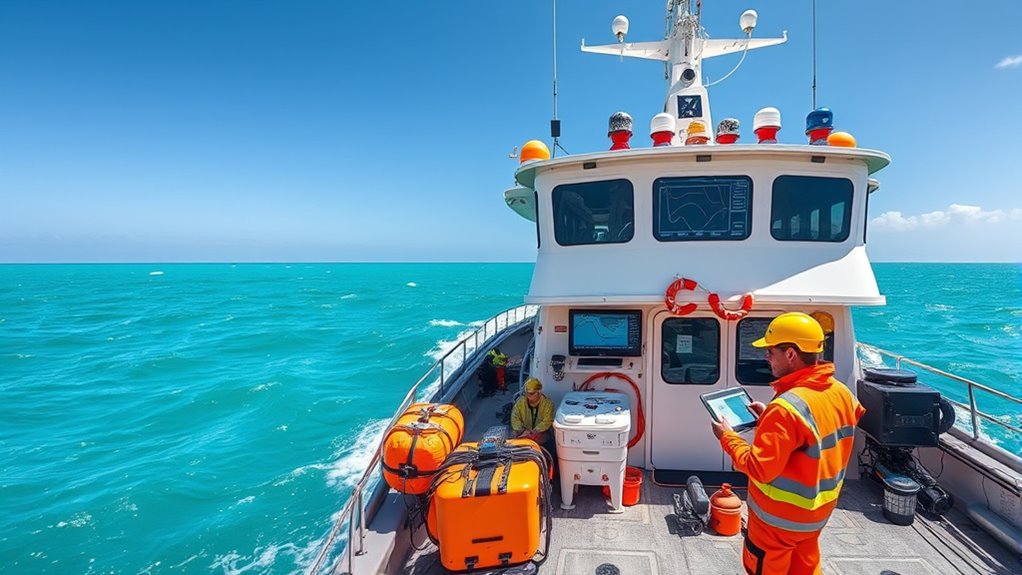
Have you ever wondered how scientists measure the vast and mysterious oceans? It’s through a combination of meticulous techniques and advanced technology that they gather essential data to understand marine environments. One of the primary methods used is marine sampling, where researchers collect physical, chemical, and biological samples from different ocean depths and locations. Whether it’s water, sediment, or marine organisms, these samples provide the raw information needed to analyze ocean health, biodiversity, and climate impacts. Marine sampling is precise and systematic, often involving specialized equipment like buoys, remotely operated vehicles, and sampling bottles. The data collected from these samples forms the foundation for understanding complex ocean processes. Accurate sampling procedures are crucial for reliable analysis and meaningful results.
Once the samples are collected, the next step is making sense of the vast amount of information. This is where data visualization plays a pivotal role. Oceanographers rely on sophisticated tools and software to turn raw data into visual formats such as graphs, heat maps, and 3D models. These visualizations make complex patterns understandable, revealing trends in temperature, salinity, nutrient levels, and other critical parameters. By translating numbers into images, scientists and policymakers can quickly grasp the state of the ocean and spot changes over time. For example, a heat map might show rising sea surface temperatures in specific regions, signaling potential climate shifts or coral bleaching risks.
Data visualization also helps in communicating findings to a broader audience. It’s far easier to understand a graph or a color-coded map than to interpret raw datasets filled with numbers and jargon. This clarity is essential for making informed decisions about marine conservation, resource management, and climate change mitigation. The combination of marine sampling and data visualization ensures that oceanography isn’t just about collecting data but actively translating it into actionable insights. This process enables scientists to monitor ocean health, predict future changes, and develop strategies to protect marine ecosystems.
In essence, these techniques allow you, as an engaged observer, to see beyond the surface and understand the complex interactions happening beneath the waves. Marine sampling provides the foundational data, while data visualization transforms that information into meaningful stories about our oceans. Together, they form a powerful toolkit that turns raw scientific measurements into knowledge that can help safeguard our planet’s most expansive and critical resource. Additionally, advancements in oceanographic technology continue to enhance the precision and scope of data collection, leading to more comprehensive understanding of marine environments.
Frequently Asked Questions
How Can Citizen Scientists Contribute to Oceanography Data Collection?
As a member of the marine citizenry, you can crucially contribute to oceanography data collection by gathering observations like water temperature, pollution levels, or marine life sightings. Your hands-on efforts help expand data coverage. Additionally, you play a vital role in data validation, ensuring accuracy and reliability. Your contributions support researchers in understanding ocean health and trends, making your participation significantly in advancing marine science.
What Are the Biggest Challenges in Oceanographic Data Accuracy?
You face major challenges in oceanographic data accuracy, mainly due to measurement errors and issues with data precision. These errors can stem from equipment limitations, environmental factors, or human mistakes, affecting the reliability of your data. To improve accuracy, you need to calibrate instruments regularly, use standardized methods, and cross-verify measurements. Addressing these challenges guarantees your ocean data truly reflects the marine environment, supporting better research and decision-making.
How Is Ocean Data Used to Predict Climate Change Impacts?
You use ocean data to predict climate change impacts by tracking marine heatwaves and carbon sequestration. When you analyze temperature patterns and ocean chemistry, you can forecast how rising temperatures affect marine ecosystems. This data helps you understand carbon absorption in oceans, which influences global climate models. By monitoring these factors, you gain insights into future climate scenarios, enabling better planning and mitigation strategies for climate change challenges.
What Technological Advances Are Improving Marine Data Analysis?
You’re benefiting from advances like remote sensing, which collects vast ocean data from satellites, providing real-time insights. Machine learning algorithms analyze this data efficiently, identifying patterns and predicting trends more accurately. These technological innovations enable you to understand ocean changes better, improve climate models, and develop more effective conservation strategies. Together, remote sensing and machine learning are transforming marine data analysis, making it faster, more precise, and highly impactful for oceanography research.
How Can Policymakers Better Utilize Oceanography Statistics?
You can better utilize oceanography statistics by integrating them into marine policy through data-driven decision making. Use these insights to craft sustainable policies, manage marine resources effectively, and respond proactively to environmental changes. By prioritizing transparency and collaboration, you guarantee policymakers and scientists work together, making informed choices that protect ocean health and support sustainable development, ultimately leading to more resilient and adaptive marine policies.
Conclusion
By mastering oceanography statistics, you reveal the hidden stories of the sea, like a sailor reading the stars to navigate unknown waters. These data points are your compass, guiding you through vast, uncharted marine mysteries. When you interpret marine data with clarity, you illuminate the ocean’s secrets like the first light at dawn, turning chaos into clarity. Embrace these tools, and you’ll chart a course through the deep with confidence and purpose.