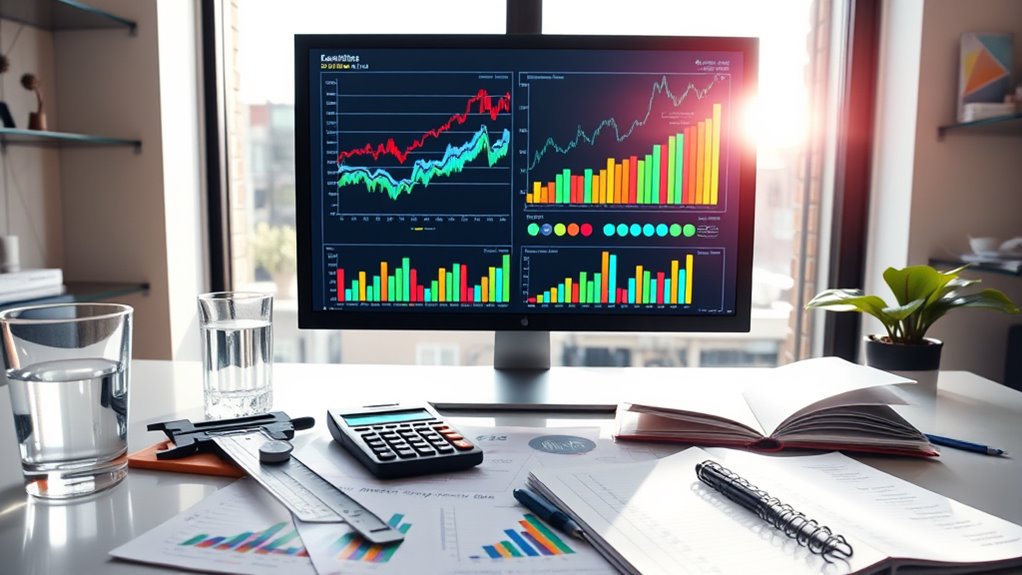
To analyze economic data effectively, you use statistical tools like moving averages, trend analysis, and regression models. These methods help smooth out short-term fluctuations and identify long-term patterns in indicators like inflation and unemployment. You can also apply time series analysis to track changes over time and correlation analysis to explore relationships between variables. Mastering these techniques allows you to understand economic dynamics better and predict future trends—there’s much more to explore below.
Key Takeaways
- Utilize time series analysis to track and forecast inflation and unemployment trends over specific periods.
- Apply moving averages and trend lines to smooth data and identify long-term patterns.
- Use regression models to examine relationships between inflation, unemployment, and other economic variables.
- Conduct correlation analysis to assess the strength and direction of relationships among economic indicators.
- Implement statistical tests to detect structural breaks, shifts, or anomalies in economic data over time.
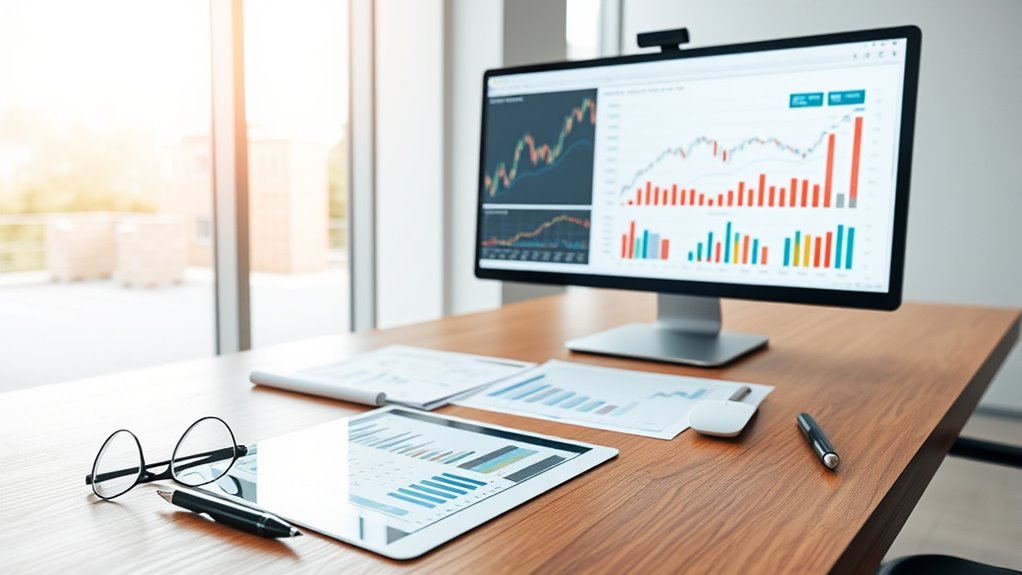
Have you ever wondered how economists determine the health of an economy? It’s a complex process that involves analyzing various data points, with inflation trends and unemployment metrics playing essential roles. These indicators help paint a clear picture of economic stability and growth, allowing policymakers and analysts to make informed decisions. When examining inflation trends, you look at how prices for goods and services change over time. If prices are rising steadily, it indicates moderate inflation, which often signals a healthy economy. However, if inflation accelerates uncontrollably, it can erode purchasing power and create economic uncertainty. Conversely, deflation, or falling prices, might suggest weak demand and sluggish growth. Tracking these trends requires statistical tools that analyze price data across sectors and time periods, helping you identify patterns or sudden shifts that could impact monetary policy. Utilizing data analysis techniques can improve the accuracy of your insights by revealing underlying patterns.
Unemployment metrics are equally essential. They measure the percentage of the labor force actively seeking work but unable to find it. By monitoring these metrics, you gain insight into the job market’s strength and the overall economic environment. A low unemployment rate typically signals robust economic activity, while high unemployment can reflect economic distress or recession. Economists use different statistical measures, such as the U-3 and U-6 unemployment rates, to capture various aspects of labor underutilization. These metrics help you understand not just how many people are jobless but also the quality of available jobs and underemployment levels. Combining data on unemployment with inflation trends provides a broad view of economic conditions, enabling you to assess whether an economy is overheating or underperforming.
To analyze these indicators accurately, you rely on various statistical tools, like moving averages, trend analysis, and regression models. These tools help smooth out short-term fluctuations, highlight long-term patterns, and establish relationships between different variables. For example, you might use a time series analysis to observe how inflation trends evolve over months or years, or employ correlation analysis to see how unemployment metrics change in response to economic policies. By applying these techniques, you can make sense of raw data, identify potential issues early, and contribute to forecasting future economic conditions. In essence, understanding inflation trends and unemployment metrics through robust statistical analysis allows you to evaluate an economy’s health with greater precision and confidence.
Frequently Asked Questions
How Do Economic Indicators Influence Policymaking Decisions?
You use economic indicators like consumer confidence and inflation rates to shape policymaking decisions. When consumer confidence is high, you might consider policies that support growth, while rising inflation rates could prompt you to implement measures to control inflation. These indicators provide real-time insights, helping you assess economic health and adjust policies accordingly to stabilize the economy and encourage sustainable growth.
What Are the Limitations of Using Statistical Tools in Economic Data Analysis?
You should be aware that statistical tools have limitations like sample bias, which can skew your results if your sample isn’t representative. Data overfitting is another issue, where your model fits the training data too closely and performs poorly on new data. These problems can lead you to incorrect conclusions, so always validate your models and verify your data is as accurate and unbiased as possible.
How Can Economists Handle Missing or Incomplete Data?
You can handle missing or incomplete data by applying data imputation techniques, filling gaps with estimates based on available information. Additionally, you should perform data validation to guarantee accuracy and consistency. These steps help improve your dataset’s reliability, enabling more precise analysis. Always cross-check imputed data and validation results, so your conclusions remain sound and trustworthy, even when dealing with imperfect data.
What Software Is Best for Advanced Economic Data Analysis?
You should consider using software like R or Python for advanced economic data analysis. These tools excel in data visualization, helping you interpret complex datasets visually, and support machine learning techniques for predictive modeling. Both have extensive libraries tailored for economists, allowing you to handle large datasets efficiently. R’s tidyverse and Python’s scikit-learn are especially powerful for integrating data visualization and machine learning into your analyses.
How Do Economic Data Trends Impact Global Markets?
You see that economic data trends, like a 5% growth in manufacturing, directly influence global markets by increasing market volatility. When investors interpret positive data, they often feel more confident, boosting investor sentiment and driving up stock prices. Conversely, negative trends can cause uncertainty, leading to market dips. Understanding these trends helps you anticipate market movements, manage risks, and make informed investment decisions in an ever-changing global economy.
Conclusion
By mastering these statistical tools, you’ll navigate economic data like a skilled captain steering through a storm. Just as a compass guides a sailor, these methods help you find clarity amid complex numbers. Embrace these techniques to make informed decisions and uncover meaningful insights. With practice, you’ll analyze data confidently, turning raw numbers into powerful stories that drive economic understanding. Now, go ahead and harness these tools—you’re well on your way to becoming an expert.

