
When working with normal distributions in homework problems, you should start by identifying the mean and standard deviation of the data set. Convert raw scores into z-scores to standardize values and easily find probabilities using normal distribution tables or software. Remember, understanding how data clusters around the mean makes probability calculations more straightforward. If you continue, you’ll discover techniques that simplify analyzing data and solving real-world problems accurately.
Key Takeaways
- Convert raw data to z-scores to standardize values before computing probabilities.
- Use standard normal tables or software to find probabilities associated with z-scores.
- Calculate mean and standard deviation accurately to understand data spread and identify outliers.
- Apply probability concepts to determine the likelihood of data falling within specific ranges.
- Interpret results to answer questions about data distribution, percentages, or likelihoods in homework problems.

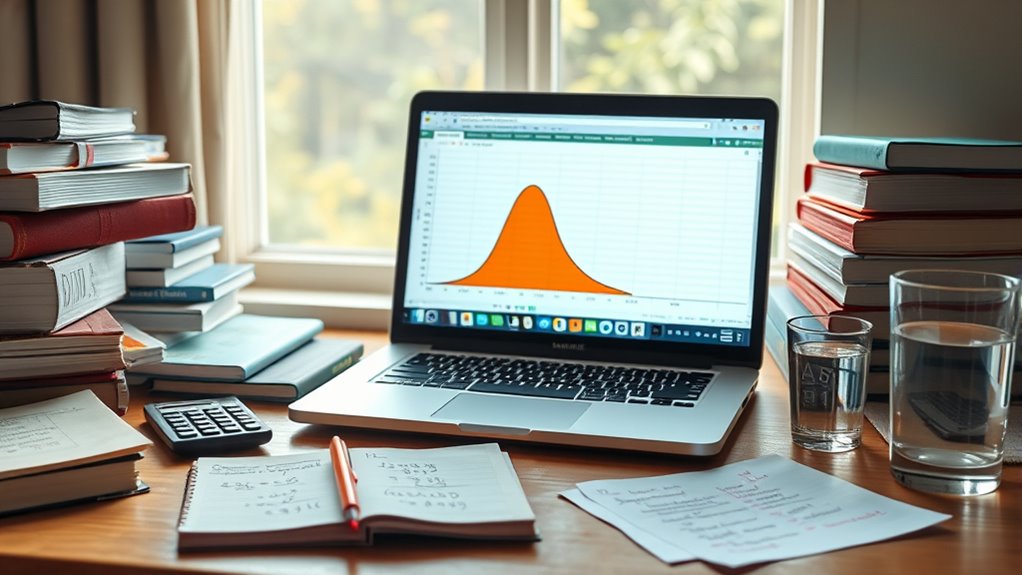
Have you ever wondered why many data sets in your homework tend to cluster around a central value? This phenomenon isn’t just random; it’s a hallmark of normal distributions. When you work with these distributions, understanding the key concepts can make your calculations much more straightforward. Normal distributions are symmetric, bell-shaped curves that describe how data points are spread around the mean, which is the central value. Many real-world phenomena, like test scores or heights, follow this pattern, making it essential to grasp how to handle them effectively.
One of the most important skills in working with normal distributions is performing probability calculations. These calculations help you determine the likelihood that a particular data point falls within a certain range. To do this accurately, you need to convert raw data into standard scores, known as z-scores, which measure how many standard deviations a value is away from the mean. This is where standard deviation methods come into play. By calculating the standard deviation, you understand the dispersion of your data, which directly influences the shape of the normal curve. Once you have the z-scores, you can consult standard normal distribution tables or use statistical software to find probabilities. This process simplifies complex data sets and helps you answer questions like, “What’s the probability that a student scores above a certain threshold?”
Perform probability calculations by converting data to z-scores and using standard normal tables.
Additionally, understanding how to use standard deviation methods allows you to identify outliers and assess data variability. If a value is more than two standard deviations away from the mean, it’s considered unusual or an outlier. Recognizing these outliers can be vital for accurate probability calculations, as they can skew results if not properly accounted for. When working through homework problems involving normal distributions, always start by calculating the mean and standard deviation. From there, convert your data points into z-scores and interpret the results using probability tables or software.
Mastering these concepts also enables you to answer real-world questions more confidently. For example, if you know the average height of a population and its standard deviation, you can estimate the percentage of people taller or shorter than a specific height. This practical application of probability calculations and standard deviation methods makes your homework more meaningful and relevant. In essence, understanding normal distributions, and how to work with them through probability calculations and standard deviation methods, is essential for analyzing data accurately. It provides a clear framework for interpreting data clusters, making informed predictions, and solving various problems efficiently.

Texas Instruments TI-Nspire CX II CAS Color Graphing Calculator with Student Software (PC/Mac)
Color Screen. The screen size is 320 x 240 pixels (3.5 inches diagonal) and the screen resolution is…
As an affiliate, we earn on qualifying purchases.
As an affiliate, we earn on qualifying purchases.
Frequently Asked Questions
How Do I Handle Skewed Distributions in Homework Problems?
When you encounter skewed distributions, you should perform a skewness adjustment by applying data transformation techniques like log, square root, or reciprocal transformations. These methods help reduce skewness, making your data more normal and easier to analyze. After transformation, check if the distribution is closer to normal. This approach simplifies your homework problems and improves the accuracy of your statistical analyses.
Can Normal Distribution Methods Be Applied to Small Sample Sizes?
Normal distribution methods can be applied to small sample sizes, but with caution. You should consider sample size limitations because small samples may not accurately reflect the population, making distribution assumptions less reliable. When working with small samples, it’s often better to use t-distribution methods rather than normal distribution, as they account for increased variability. Always check whether your data reasonably meets the assumptions before applying normal-based techniques.
What Are Common Mistakes When Calculating Probabilities With Normal Distributions?
A stitch in time saves nine, so avoid common mistakes when calculating probabilities with normal distributions. You might misinterpret errors by confusing z-scores or neglecting to verify if the data fits a normal model. Calculation oversights, like forgetting to convert raw data or misreading tables, lead to incorrect results. Always double-check your work, ensure proper assumptions, and understand the problem thoroughly to prevent these pitfalls.
How Do I Interpret Z-Scores in Real-World Contexts?
Your z-score interpretation tells you how many standard deviations a data point is from the mean. In real-world applications, a positive z-score indicates a value above average, while a negative one shows it’s below. Use this to assess whether a measurement is typical or unusual, like comparing test scores or measuring product weights. Understanding z-scores helps you make informed decisions by relating data points to the overall distribution.
Are There Alternatives to Normal Distribution for Non-Parametric Data?
When dealing with ranked data or ordinal variables, you should explore alternatives like the Wilcoxon signed-rank test or the Mann-Whitney U test. These non-parametric methods don’t assume normality, making them perfect for analyzing non-parametric data. They analyze the ranks instead of raw data, revealing insights that standard normal distribution methods might miss. Ready to reveal more accurate interpretations? These tests could be your secret weapon.
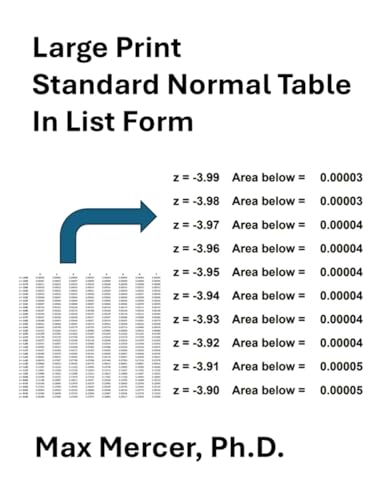
Large Print Standard Normal Table in List Form: Z-Scores and Areas Below
As an affiliate, we earn on qualifying purchases.
As an affiliate, we earn on qualifying purchases.
Conclusion
Remember, working with normal distributions becomes easier when you understand the fundamentals. Practice makes perfect, and the more you work with these problems, the clearer they’ll become. Don’t forget, a problem shared is a problem halved—so don’t hesitate to seek help if needed. Keep your eyes on the prize, stay persistent, and you’ll master normal distributions in no time. With patience and effort, you’ll find that understanding is just around the corner.

Standard Deviation Calculator
Effortless Input
As an affiliate, we earn on qualifying purchases.
As an affiliate, we earn on qualifying purchases.

Statistics Laminate Reference Chart: Parameters, Variables, Intervals, Proportions (Quickstudy: Academic )
This guide is a perfect overview for the topics covered in introductory statistics courses.
As an affiliate, we earn on qualifying purchases.
As an affiliate, we earn on qualifying purchases.