
Virtual reality data visualization immerses you in a 3D environment where you can actively explore complex datasets. You can rotate, zoom, and navigate through data points with natural gestures, making abstract information more tangible and easier to understand. This immersive approach promotes deeper engagement, collaboration, and faster insights by supporting multisensory cues like visuals and sounds. To discover how this innovative technology enhances analysis and decision-making, just keep exploring the possibilities.
Key Takeaways
- Virtual reality enables immersive 3D exploration of datasets for a deeper understanding of complex information.
- Users can interact naturally with data through rotation, zooming, and navigation in a virtual environment.
- VR enhances engagement by reducing distractions and promoting active participation in data analysis.
- Multisensory cues in VR improve comprehension and retention of visualized data insights.
- Safe, standards-compliant VR platforms facilitate collaborative analysis and faster decision-making.
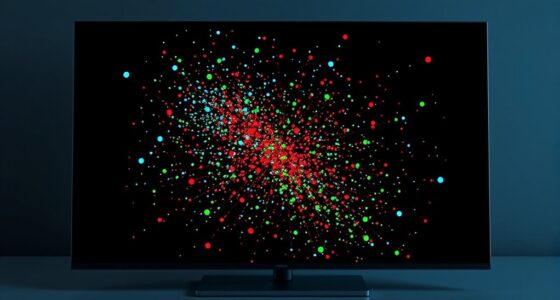
Virtual reality (VR) is transforming how we visualize and interpret complex data sets. With immersive environments, VR allows you to step inside your data, making abstract numbers and charts tangible and easier to understand. Instead of scrolling through flat graphs on a screen, you can explore data points in three-dimensional space, gaining new perspectives that static visuals simply can’t provide. This shift opens up opportunities for more interactive interfaces, where you actively participate in data analysis rather than passively observing it. As a user, you become part of the visualization, which increases user engagement and helps uncover insights that might otherwise remain hidden.
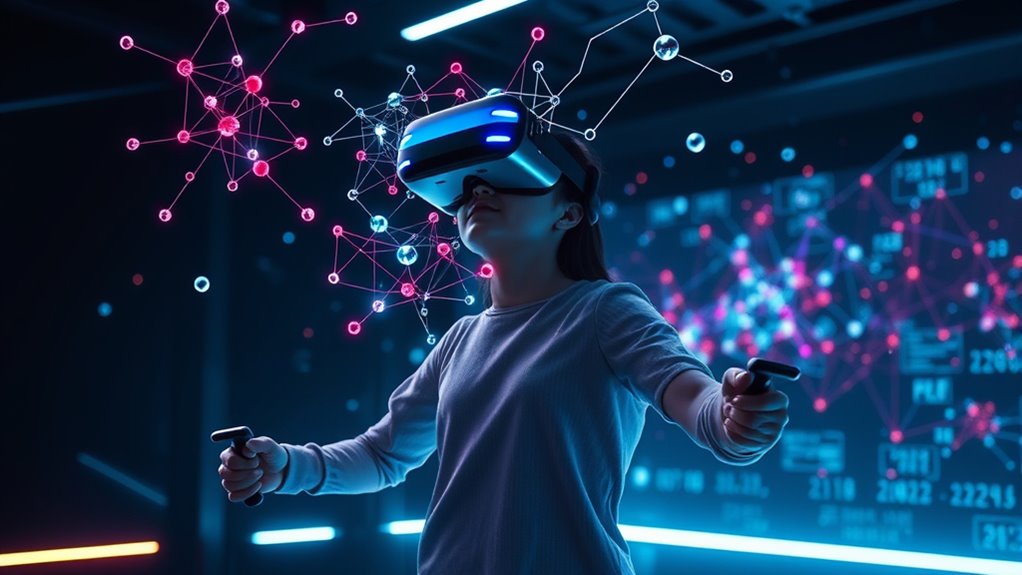
In VR, you’re not limited to viewing data from a single angle. Instead, you can rotate, zoom, and navigate through complex datasets with natural gestures, creating a seamless and intuitive experience. This hands-on approach boosts your ability to detect patterns, outliers, and relationships among variables. By manipulating data in real time, you can test hypotheses instantly and see immediate results, making your analysis more dynamic and responsive. The interactive interfaces offered by VR tools enable you to customize views, focus on specific data clusters, or explore multiple layers of information without losing context. This personalized approach keeps you engaged, making the process more productive and less tedious.
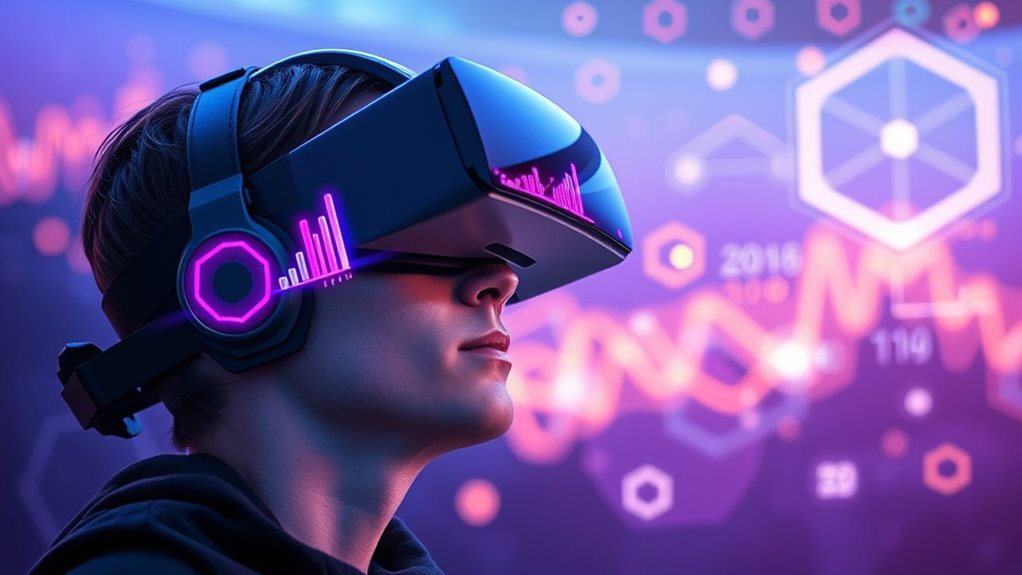
Moreover, the immersive nature of VR enhances user engagement by removing distractions typical of traditional data visualization methods. When you’re fully immersed in a 3D environment, your focus sharpens, and your cognitive load decreases because you’re not juggling multiple windows or screens. Instead, you’re surrounded by your data, which feels more tangible and real. This heightened engagement encourages deeper exploration and collaboration, especially when multiple users share a virtual space to analyze data collectively. They can point, annotate, and discuss insights within the environment, fostering teamwork and accelerating decision-making.
Additionally, VR’s capability to combine visual, spatial, and sometimes auditory cues makes data more accessible and memorable. You’re more likely to retain complex information when it’s presented in an interactive, multisensory format. The technology also promotes innovative ways of visualizing data, such as virtual dashboards, 3D scatter plots, or animated flow diagrams, all of which enhance user engagement by offering diverse perspectives. Overall, VR’s interactive interfaces are revolutionizing data visualization by making analysis more engaging, intuitive, and insightful—empowering you to see your data in ways that were once impossible. Incorporating vetted safety standards for VR hardware and software ensures a safe and comfortable experience as you explore these new frontiers in data analysis.
Frequently Asked Questions
What Are the Best VR Headsets for Data Visualization?
The best VR headsets for data visualization are the Oculus Quest 2, HTC Vive Pro 2, and Valve Index. These VR hardware options deliver immersive analytics with high-resolution displays, precise tracking, and comfortable designs. They enable you to explore complex data sets in 3D effectively, making your visualization experience more engaging and insightful. Choose one based on your budget and the level of immersion you desire for ideal results.
How Can I Ensure Data Privacy in VR Environments?
To guarantee data privacy in VR environments, you should implement strong data encryption to protect sensitive information from unauthorized access. Additionally, use robust user authentication methods, like multi-factor authentication, to verify users’ identities. Regularly update your security protocols and educate users on safe practices. By combining these measures, you create a secure VR space where your data stays private and protected against potential threats.
What Skills Are Needed to Create VR Data Visualizations?
You need a blend of skills to craft compelling VR data visualizations, like a chef combining ingredients for a perfect dish. Master data storytelling to make your insights resonate emotionally, and develop expertise in immersive analytics to create engaging experiences. Proficiency in 3D modeling, coding (like C# or Unity), and data analysis is essential. With these skills, you’ll turn raw data into immersive stories that captivate and inform your audience.
How Scalable Are VR Data Visualization Solutions?
VR data visualization solutions are quite scalable, but you’ll face scalability challenges like maintaining performance as data complexity grows. To guarantee smooth experiences, you need to focus on performance optimization techniques such as efficient rendering, data compression, and level-of-detail management. By addressing these challenges early, you can create scalable VR visualizations that handle larger datasets without compromising user experience or system stability.
What Are the Costs Associated With Developing VR Visualization Tools?
Oh, developing VR visualization tools is a bargain—just a small fortune! You’ll need a thorough cost analysis to understand development expenses, which include hardware, software, and skilled personnel. Expect high initial investments for quality VR headsets, powerful computers, and custom programming. While costs can vary wildly, be prepared for ongoing expenses like updates and maintenance, making VR development a costly yet rewarding adventure in data storytelling.
Conclusion
Stepping into the world of virtual reality data visualization truly transforms how you explore information—it’s like holding the universe in your hands. You’ll find yourself maneuvering data landscapes that are more immersive and intuitive than ever before. This technology isn’t just a tool; it’s a game-changer that makes complex data feel as simple as a walk in the park. Embrace VR, and watch your understanding of data explode into a whole new dimension!