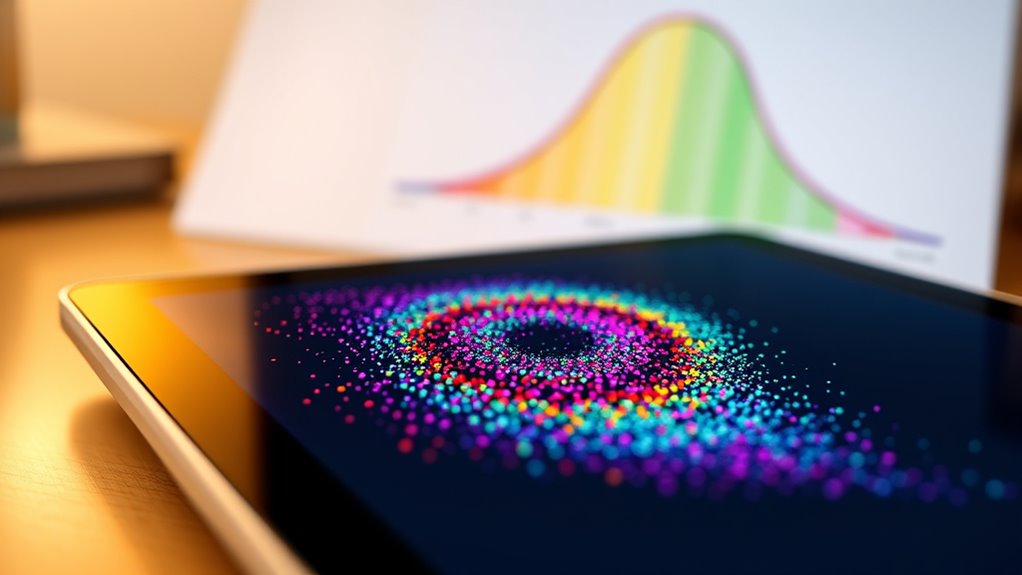
Standard deviation measures how much your data points vary from the average, showing whether values are tightly clustered or widely spread out. It’s important because it reveals the consistency of your data and helps you assess reliability, risks, or stability in different fields like finance, healthcare, or manufacturing. Understanding this key statistic allows you to make smarter decisions based on the data’s variability. Keep exploring to see how standard deviation is calculated and applied in real-world situations.
Key Takeaways
- Standard deviation measures how much data points vary from the average, indicating data consistency or dispersion.
- It helps assess the reliability of the mean and identify outliers or variability in data sets.
- A low standard deviation shows data points are closely clustered around the mean; a high one indicates wider spread.
- Understanding standard deviation is essential for informed decision-making in finance, healthcare, manufacturing, and education.
- It provides context to data by revealing the degree of fluctuation, supporting accurate interpretation and analysis.
Understanding the Concept of Standard Deviation

Understanding the concept of standard deviation is essential because it tells you how much data points vary from the average value. It measures the dispersion of data around the mean, giving you a sense of consistency or spread within your dataset. A low standard deviation indicates the data points are tightly clustered near the mean, while a high value shows they’re more spread out. It is particularly useful in assessing the accuracy of measurements and understanding the variability within your data. Additionally, standardized measures like z-scores rely on standard deviation to assess how unusual a data point is within a distribution. Symbols like σ (for populations) and s (for samples) represent it. This measure helps identify outliers and assess data reliability. Recognizing the distribution pattern of your data can also provide deeper insights into its behavior and underlying characteristics.
The Significance of Measuring Variability

Measuring variability plays a key role in how you interpret data because it reveals the degree of spread among data points within a dataset. When variability is high, data points are widely dispersed, which can suggest outliers or inconsistent behavior. Understanding tableware in different cultures highlights how traditions and etiquette influence the presentation and significance of dining items. Low variability indicates that data points are clustered closely together, reflecting stability and uniformity. This helps you assess the reliability of average values like the mean. Variability also informs your decision-making, highlighting how much data fluctuates and whether results are dependable. Recognizing measurement consistency is essential for ensuring accurate interpretations of data trends, especially in areas like Gold IRA Rollovers, where precise data can significantly impact investment decisions. Additionally, understanding the contrast ratio of projectors can help evaluate image quality and viewer experience. Being aware of data dispersion can assist in identifying patterns and anomalies, supporting more informed conclusions.
How to Calculate Standard Deviation

To calculate standard deviation, you start by finding the mean of your data set, which involves adding all the values together and dividing by the number of data points. Next, subtract the mean from each data point to find the differences. Square each difference to make all values positive. Add all the squared differences together to get the sum. Then, divide this sum by the total number of observations (for population) or by one less than that (for sample) to find the variance. Finally, take the square root of the variance to get the standard deviation. This process measures the spread of your data, helping you understand how much the data points vary from the average. Using tools like calculators or software can speed up these steps. Additionally, understanding the distribution of your data can provide deeper insights into variability and patterns. Recognizing the shape of your data distribution can assist in selecting appropriate statistical methods for analysis.
Practical Uses Across Different Fields

Standard deviation finds wide-ranging applications across various fields, helping professionals make informed decisions by evaluating data variability. In business and finance, you use it to assess investment risks, analyze performance fluctuations, and improve forecasting accuracy. Portfolio managers rely on it to diversify investments and minimize overall risk. In manufacturing, standard deviation ensures product consistency, monitors processes, and supports quality improvements through methodologies like Six Sigma. Healthcare professionals analyze patient data variability and determine the significance of research results, guiding treatment decisions. Environmental scientists measure climate variability and predict natural disasters. Educators and social scientists use it to evaluate student performance and study societal trends. Additionally, understanding data variability through standard deviation enables more precise statistical analysis across disciplines. Recognizing operating hours in various sectors can also influence planning and efficiency, especially in service industries. Moreover, awareness of sampling methods can improve the accuracy of data collection and analysis in research. Understanding resources and tools available in different fields can further enhance decision-making processes. In each context, understanding data variability helps you identify patterns, manage risks, and enhance outcomes effectively. Furthermore, remote collaboration tools have revolutionized how teams work together across different locations, making data sharing and analysis more seamless.
Comparing Standard Deviation and Variance

While both standard deviation and variance quantify data dispersion, they serve different purposes and are expressed in different units. Standard deviation measures how far data points are from the mean in the same units as your data, making it more intuitive. Variance calculates the average of squared differences, resulting in units squared, which are less straightforward to interpret. Since standard deviation is the square root of variance, it directly relates to the data’s spread, while variance emphasizes larger deviations due to squaring. Variance is often used in statistical models and hypothesis tests, whereas standard deviation is preferred for communication and visualization. Understanding data variability and the relationship between these measures can help in selecting the appropriate metric for your analysis. Additionally, knowing how these measures relate to the characteristics of data variability can improve your interpretation of statistical results. Recognizing the appropriate measure for your specific context is crucial for accurate data analysis and clear communication. The choice between them can influence how you evaluate spread and consistency in your data.
Common Misunderstandings to Avoid

Are you aware of the common misconceptions that can lead to errors when interpreting standard deviation? Many believe it applies universally, but it mainly makes sense for normal distributions. Using it with skewed data can mislead you, so consider alternatives like the interquartile range.
Another mistake is assuming the percentages from the Empirical Rule are exact; they’re only approximations, and data can deviate, especially with small samples or outliers. People often confuse standard deviation with standard error, but they measure different things—variability versus precision.
Also, ignoring the impact of sample size can be problematic; small samples may give unreliable estimates. Cultural and Regional Breakfasts can influence how data is collected and interpreted in different contexts, so understanding the background is important. In conclusion, a low standard deviation doesn’t mean your data is accurate—just that points cluster close to the mean. Be cautious and understand these nuances to interpret data correctly. Additionally, understanding the specific types of water parks can help when planning a family vacation or choosing the right hotel with a water park.
Frequently Asked Questions
How Does Sample Size Affect the Accuracy of Standard Deviation?
When you consider how sample size affects the accuracy of standard deviation, you’ll find that larger samples give you more reliable estimates.
With more data points, your estimate gets closer to the true population standard deviation, reducing variability and increasing precision.
Conversely, small samples can lead to overestimations or underestimations.
Consequently, increasing your sample size helps you get a clearer, more accurate picture of the data’s true spread.
Can Standard Deviation Be Negative? Why or Why Not?
Imagine a river flowing smoothly, its waters never going backward. Standard deviation can’t be negative because it’s like this river—its flow measures spread, always moving forward from the mean.
Since it’s the square root of variance, which is never negative, standard deviation naturally stays above zero. So, you won’t find a negative value, because it simply reflects how much data points wander away from the average, always a positive journey.
Is a Higher Standard Deviation Always Worse?
You might wonder if a higher standard deviation is always bad. It’s not necessarily, because it depends on the situation.
In finance, a higher standard deviation can mean more risk but also the chance for higher returns.
In contrast, in manufacturing, it might signal inconsistency.
How Does Standard Deviation Relate to Confidence Intervals?
You want to understand how standard deviation relates to confidence intervals. It’s simple: a smaller standard deviation means less variability, leading to narrower confidence intervals.
When you calculate confidence intervals, you often use the standard error, which depends on the standard deviation. This relationship helps you estimate how precisely a sample reflects the whole population, making your statistical conclusions more reliable.
Can Two Datasets Have the Same Mean but Different Standard Deviations?
Picture two datasets with identical averages, yet one is tightly clustered, while the other spreads wildly. Yes, you can have the same mean but different standard deviations, revealing how data points vary around that average.
The tight set shows consistency, while the wider one indicates more variability. Recognizing this helps you compare datasets effectively, understand their behavior, and make smarter decisions based on the degree of data spread.
Conclusion
So, next time you ignore standard deviation, just remember it’s the universe’s way of reminding you that life, like data, isn’t always perfectly neat. Embrace the variability—after all, it’s what keeps things interesting. Without it, your insights would be as dull as a straight line. So, don’t dismiss the standard deviation; it’s your secret weapon for understanding the beautiful chaos around you. Who knew statistics could be so delightfully unpredictable?


