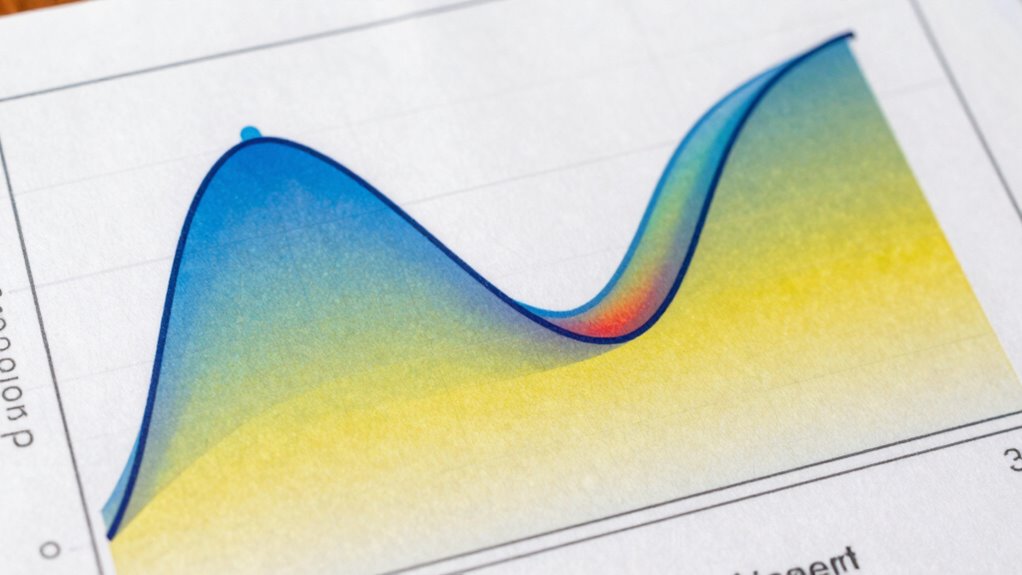

Skewness and kurtosis are key to understanding your data’s shape. Skewness shows if your data leans more to the right or left, revealing asymmetry and potential bias. Kurtosis indicates how peaked or flat the distribution is, highlighting the presence of outliers or extreme values. Recognizing these measures helps you grasp patterns beyond averages, guiding better analysis choices. Stick with it, and you’ll gain deeper insights into what your data truly reveals.

Get business pricing on monitors, keyboards and dev gear
- Business-only prices and quantity discounts
- Tax-exempt purchasing
- Multiple users, one account, clear invoices
Key Takeaways
- Skewness measures the asymmetry of data, indicating whether it leans more to the left or right.
- Kurtosis describes the peakedness or flatness of a distribution, highlighting outliers and tail heaviness.
- Positive skewness means data extends more on higher values; negative skewness indicates extension on lower values.
- High kurtosis suggests data has heavy tails and potential outliers, while low kurtosis indicates a flatter distribution.
- Understanding both helps choose appropriate statistical methods and identify data anomalies or biases.

Understanding the shape of a data distribution is vital in statistics, and two key measures that help describe this are skewness and kurtosis. When you analyze data, you’re not just interested in the average or variability; you want to understand the overall shape of the distribution. This shape reveals important information about the data’s tendencies and anomalies. Skewness, in particular, measures the asymmetry of your data distribution, indicating whether data points tend to cluster more on one side. If your data leans to the right, with a longer tail on the higher values, you have positive skewness. Conversely, if it leans to the left, with a longer tail on the lower values, the skewness is negative. Recognizing the statistical skew helps you understand whether your data is balanced or biased toward extreme values.
Kurtosis adds another layer of insight by describing the “peakedness” or flatness of your data distribution. High kurtosis means your data has a sharp peak with heavy tails, indicating the presence of outliers or extreme values. Low kurtosis suggests a flatter distribution, with data more evenly spread and fewer extreme deviations. When you examine kurtosis, you’re fundamentally assessing how much your data deviates from a normal distribution, which is the classic bell curve. This information is vital because many statistical tests assume normality. If your data’s kurtosis is markedly different from that of a normal distribution, it signals that you may need to adjust your analysis or use different methods. Additionally, understanding distribution shape helps in selecting appropriate statistical models and methods. Recognizing the impact of sample size on skewness and kurtosis can also improve the reliability of your analysis, especially with smaller datasets. Moreover, considering data distribution patterns can help identify potential issues such as outliers or data entry errors that might skew your results.
Analyzing skewness and kurtosis together can also reveal whether your data has a multimodal distribution, which might require different analytical approaches. Recognizing these patterns helps you decide whether to transform your data or choose appropriate statistical techniques. It’s also important to remember that skewness and kurtosis are not just abstract concepts; they have practical applications in finance, quality control, research, and many other fields where understanding data shape influences decision-making. By analyzing these measures, you gain a clearer picture of your data’s structure, which ultimately leads to more accurate insights and better-informed conclusions.
statistical skewness and kurtosis calculator
As an affiliate, we earn on qualifying purchases.
As an affiliate, we earn on qualifying purchases.
Frequently Asked Questions
How Do Skewness and Kurtosis Impact Real-World Data Analysis?
You can see that skewness and kurtosis impact your data analysis by revealing distribution asymmetry and tail behavior. When skewness is high, data leans toward one side, affecting your interpretations and model accuracy. Kurtosis shows whether your data has heavy or light tails, influencing risk assessments or outlier detection. Understanding these measures helps you better grasp the data’s shape, leading to more accurate insights and informed decision-making.
Can Skewness and Kurtosis Be Negative Simultaneously?
Yes, skewness and kurtosis can be negative simultaneously. While negative skewness implies a distribution tail extends to the left, negative kurtosis suggests a flatter distribution with less extreme outliers. The symmetry implications highlight that the distribution isn’t heavily skewed or peaked. This combination indicates a more symmetric and less heavy-tailed shape, affecting your interpretation of data, especially when evaluating risk or variability in real-world scenarios.
How Sensitive Are Skewness and Kurtosis to Outliers?
Skewness and kurtosis are quite sensitive to outliers, making outlier detection essential. Outliers can considerably distort these measures, exaggerating or diminishing asymmetry and tail behavior. To mitigate this, you should perform outlier detection before analyzing skewness and kurtosis. Data normalization also helps reduce the impact of outliers, ensuring your measures reflect the true distribution rather than anomalies. This process leads to more accurate insights into your data’s shape.
Are There Alternative Measures to Skewness and Kurtosis?
You can explore alternative metrics like the median, interquartile range, or the Gini coefficient to understand distribution shape better. These measures often provide more robust insights, especially when outliers distort skewness and kurtosis. While skewness and kurtosis focus on asymmetry and tail behavior, these alternatives offer a deeper understanding of data spread and inequality. Using multiple metrics helps you grasp the true nature of your data’s distribution.
How Do Sample Size and Data Distribution Affect These Metrics?
Sample size and data distribution considerably influence skewness and kurtosis. Small samples tend to have higher variability, which can distort these metrics, making the distribution appear more skewed or kurtotic than it truly is. If your data’s distribution shape is asymmetric or has outliers, skewness and kurtosis will reflect that. Larger samples generally provide more stable, reliable measures, reducing the impact of random sample variability on these shape characteristics.
data distribution analysis tools
As an affiliate, we earn on qualifying purchases.
As an affiliate, we earn on qualifying purchases.
Conclusion
Now that you understand skewness and kurtosis, you can see how they reveal the shape of data distributions. Skewness shows if data leans to one side, while kurtosis indicates how heavy or light the tails are. By exploring these concepts, you can better interpret real-world data and challenge assumptions. So, next time you analyze data, remember: understanding distribution shapes isn’t just theory—it’s a powerful tool to uncover hidden insights!
As an affiliate, we earn on qualifying purchases.
As an affiliate, we earn on qualifying purchases.
Halloween Picks
halloween
As an affiliate, we earn on qualifying purchases.