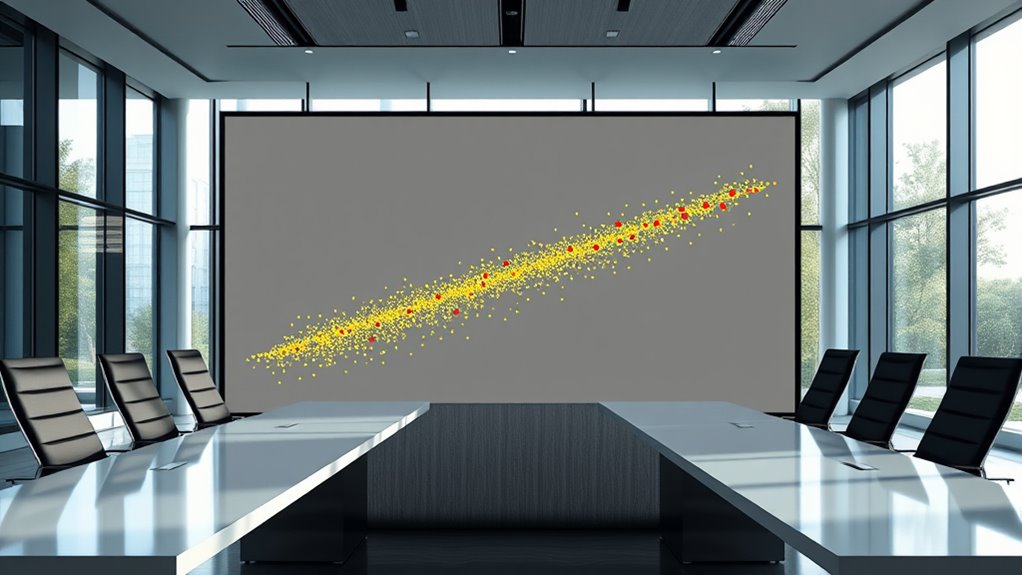
Outliers are data points that stand out from the rest, often caused by errors, variability, or unique conditions. They can skew your results and affect the accuracy of your analysis. You can identify outliers using methods like Z-scores, IQR, or visual tools such as box plots. Managing them might involve removing or adjusting these points. Keep exploring how outliers impact different fields and detection techniques to improve your data insights.
Key Takeaways
- Outliers are data points that significantly differ from other observations, potentially caused by errors or genuine variability.
- Detection methods include statistical techniques like Z-score, IQR, and visual tools such as box plots.
- Outliers can distort statistical measures and impact data modeling and analysis accuracy.
- Managing outliers involves identification, justification, and methods like removal, winsorizing, or imputation.
- Outliers’ significance varies across fields, influencing insights in economics, biology, psychology, and technology.
What Are Outliers and How Are They Identified?

Have you ever wondered what makes a data point stand out from the rest? Outliers are those unusual data points that differ markedly from other observations in your dataset. They can be much higher or lower than most values, often caused by variability or errors. Recognizing data anomalies is important because they can distort statistical measures like the mean or median, leading to misleading conclusions. Additionally, in the context of AI in Education, outliers can impact the effectiveness of intelligent tutoring systems by skewing data used for personalization. Identifying outliers is essential because they can distort statistical measures like the mean or median, leading to misleading conclusions. To detect them, you can use statistical methods like the Z-score or modified Z-score, which measure how far a point deviates from the average.
Visual tools like box plots help reveal outliers by showing data distribution clearly. Machine learning algorithms and data visualization are also valuable for spotting outliers, especially in complex or large datasets.
Proper identification is key to effective data analysis.
Common Causes and Origins of Outliers

Outliers often originate from a variety of causes, many of which stem from errors in data collection or processing. Human mistakes, like typos during data entry, can create false outliers. Faulty measurement tools or devices may produce incorrect data points, leading to outliers. Headphones, for example, can sometimes be affected by hardware issues that cause inconsistent readings or data corruption. Sampling issues, where the sample isn’t representative of the population, also contribute. Unusual conditions during data collection—such as environmental factors or unique circumstances—can generate genuine outliers. Errors in experimental design, like flawed setups or systematic errors, may cause data points that don’t reflect the true measurement. Additionally, natural variations or emerging trends can produce authentic outliers, revealing new patterns or shifts in behavior. Recognizing these causes helps you differentiate between errors and meaningful outliers in your data. Furthermore, understanding the diversification of investment portfolios can aid in mitigating risks associated with anomalous data points impacting financial decision-making.
Effects of Outliers on Data Interpretation and Results

Outliers can substantially alter the way you interpret your data, often skewing key statistical measures and leading to misleading conclusions. They can inflate the mean and standard deviation, making data seem more variable or centered differently than it truly is.
While the median is less affected, outliers can still cause slight shifts. Outliers also influence skewness, distorting the apparent symmetry of your data, and increase kurtosis, suggesting more extreme deviations. Additionally, understanding climate control options can help identify and address anomalies caused by unusual data points, ensuring more accurate analysis.
These effects impact data modeling and prediction, potentially reducing accuracy if outliers aren’t managed properly. In time series analysis, outliers can distort trends and seasonality, affecting forecasts.
Strategies for Managing and Addressing Outliers

Managing and addressing outliers effectively is key to ensuring accurate data analysis. To do this, start with visual inspection using box plots, scatterplots, or histograms to identify obvious outliers. You can also apply statistical methods like the Z-score, flagging scores above 3 or below -3, or use the IQR method, which considers values outside Q1 – 1.5IQR or Q3 + 1.5IQR as outliers. For skewed data, the robust Z-score, involving median and MAD, is helpful. Once detected, consider treatment options like removing outliers if they’re errors, winsorizing to limit their impact, or imputation to replace extreme values. Incorporating powerful persuasive words can enhance the clarity and impact of your data presentation, making your insights more compelling and easier to understand. Recognizing the importance of hackathons, such as those organized by institutions like MIT or through internal company events, can foster innovative approaches to data challenges. Always document your decisions and justify your chosen approach to maintain transparency and reproducibility.
The Role of Outliers in Different Disciplines

Understanding the role of outliers across different disciplines reveals how these extreme data points can both challenge and enhance analysis.
In economics, outliers can skew data on inflation, GDP, and income, influencing market risk assessments and regulatory decisions. Recognizing these anomalies helps improve economic models and data quality.
In biology, outliers may signal rare genetic mutations or unusual environmental conditions, guiding research on diseases and ecosystems.
Psychology benefits from identifying outliers that reveal exceptional behaviors or mental health issues, enriching understanding of human variability.
In technology, outliers in network traffic or software performance highlight security threats or bugs, improving system robustness.
Across social sciences, outliers can uncover unusual social or political trends, offering deeper insights into societal dynamics and informing policy.
Additionally, understanding data integrity and how outliers can impact it is crucial for maintaining accurate and reliable analyses across disciplines.
Key Statistical Techniques for Outlier Detection

Detecting outliers effectively requires applying statistical techniques that identify data points deviating markedly from expected patterns. The Z-score method calculates how many standard deviations a point is from the mean; values beyond ±3 are outliers, assuming normal distribution. Incorporating interior design principles like layering textures and blending modern elements with antiques can inspire more nuanced data analysis strategies. The Interquartile Range (IQR) method uses quartiles to find data outside Q1 – 1.5IQR or Q3 + 1.5IQR, marking them as outliers. The Modified Z-score relies on median and median absolute deviation, offering robustness for non-normal data. Grubbs’ Test assesses a single outlier in normally distributed data by comparing deviations to a critical value. Probabilistic models analyze the likelihood of data points, flagging low-probability points as outliers. Additionally, understanding linguistic features can help interpret anomalies in textual data, enhancing the accuracy of outlier detection methods. These methods help you identify anomalies systematically, ensuring data integrity.
Frequently Asked Questions
How Do Outliers Affect Machine Learning Model Performance?
Outliers can markedly impact your machine learning model performance by skewing predictions and affecting statistical measures like mean and variance. They introduce noise, making models unstable and less reliable across different data subsets.
This can lead to higher error metrics and poor generalization. To improve performance, you should consider removing outliers, applying data transformations, or using robust models like Random Forests that handle outliers better.
When Should Outliers Be Removed Versus Retained?
Did you know that up to 5% of data points can be outliers? When deciding to remove or retain them, consider if they result from errors or natural variation.
Remove outliers that distort analysis or are invalid, but keep legitimate extreme values that offer insight.
Use methods like winsorization or robust stats to handle them.
Always document your decisions to guarantee transparency and accurate interpretation.
Can Outliers Indicate Data Collection Issues or Real Phenomena?
You wonder if outliers show data collection issues or real phenomena. Outliers can indicate measurement errors, data entry mistakes, or sampling biases, suggesting problems in your data collection.
But they can also reveal rare events, unique patterns, or breakthroughs worth investigating. So, it’s crucial to analyze each outlier carefully—determine if it’s a mistake or meaningful—before deciding how to handle it in your analysis.
What Ethical Considerations Are Involved in Handling Outliers?
When handling outliers, you must consider ethical issues like transparency, fairness, and privacy. You should clearly document why you classify data points as outliers, ensuring others can understand your decisions.
Avoid biases that might unfairly exclude certain groups, and protect sensitive information, especially if outliers reveal personal details.
Striking a balance between data accuracy and respecting individual rights is essential to maintain trust and integrity in your analysis.
How Can Visualization Tools Improve Outlier Detection Accuracy?
You can improve outlier detection accuracy by using visualization tools like histograms, box plots, and scatter plots. These visuals help you quickly spot unusual data points that stand out from the rest.
They make patterns clearer and reduce false positives, allowing you to identify true outliers more reliably. By visually inspecting your data, you can make better decisions about which data points to review or exclude, enhancing overall analysis accuracy.
Conclusion
Outliers are like sparks that ignite your data’s true story, revealing hidden truths or unforeseen anomalies. Embrace them as guiding stars that challenge your assumptions and deepen your understanding. By recognizing their presence, you hold the key to more accurate insights and meaningful discoveries. Remember, outliers aren’t just disturbances—they’re symbols of life’s unpredictability, urging you to look beyond the surface and find clarity in the chaos. Let them inspire your journey toward wiser, more nuanced analysis.


