

The normal distribution is a key concept in statistics that shows how data tends to cluster around an average, creating a bell-shaped curve. You’ll see most data points near the mean, with fewer farther away, and the shape depends on variability measured by standard deviation. A small standard deviation means a tightly packed curve, while a larger one makes it wider. If you explore further, you’ll discover how this pattern helps you interpret data and predict outcomes more accurately.
Key Takeaways
- The normal distribution features a symmetric bell curve centered around the mean, illustrating data clustering.
- Shape and spread depend on standard deviation; smaller values produce narrower curves, larger values create wider ones.
- Standard deviation indicates how typical or unusual a data point is, guiding outlier detection and data variability assessment.
- Probabilities within the normal distribution allow for predictions and understanding of data behavior in various ranges.
- Recognizing the bell curve helps interpret real-world data, evaluate variability, and make informed decisions based on data patterns.
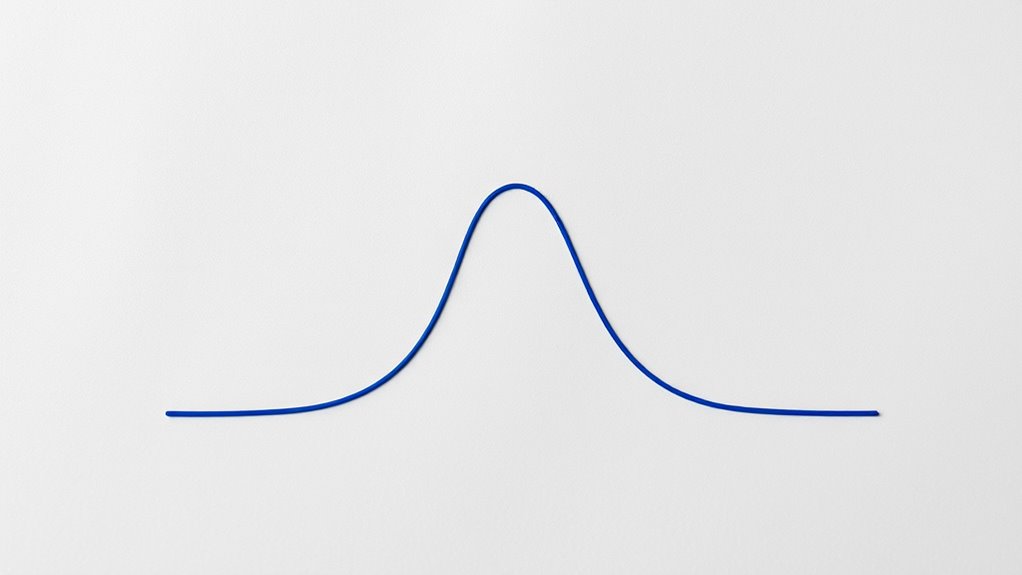
Have you ever wondered how data points tend to cluster around a central value? It’s a fascinating pattern that appears in many natural and social phenomena. When you look at a large set of data, you’ll often notice that most values gather around the average, while fewer data points appear as you move further away from that center. This pattern forms what’s known as a bell curve, which is the hallmark shape of the normal distribution. The bell curve is symmetric, with the highest point at the mean, illustrating where most data points concentrate. The spread of this curve depends on the variability in your data, which is measured by the standard deviation. A small standard deviation indicates that data points are tightly packed near the mean, resulting in a narrow, peaked bell curve. Conversely, a large standard deviation produces a wider, flatter curve, showing that data points are more dispersed.
Understanding the relationship between the bell curve and standard deviation is essential because it helps you interpret data more effectively. When you analyze a dataset, knowing the standard deviation allows you to gauge how typical or unusual a particular data point is. For example, if a value lies within one standard deviation of the mean, it’s considered quite common. If it falls beyond two or three standard deviations, it becomes more exceptional and less likely to happen by chance. This concept is fundamental in many fields, from quality control to finance, where identifying outliers or rare events is essential. Additionally, the properties of the normal distribution enable you to make predictions about the probability of certain outcomes. Since the curve is symmetric, you can use it to estimate the likelihood of values falling within specific ranges, making it a powerful tool for statistical inference. Moreover, understanding sound vibrations and their influence can also aid in interpreting data patterns in fields like sound healing or bioengineering.
In practical terms, recognizing the bell curve pattern helps you understand the behavior of data in the real world. Whether you’re evaluating exam scores, measuring heights, or analyzing stock returns, the normal distribution provides a reliable model for many naturally occurring datasets. The key is to remember that the standard deviation governs the shape and spread of the curve, giving you insight into the variability present. This understanding allows you to set realistic expectations, identify anomalies, and make informed decisions based on the data’s inherent tendencies. By mastering the concepts of the bell curve and standard deviation, you gain a clearer picture of how data behaves around the average, ultimately enhancing your ability to interpret information accurately and confidently.
Frequently Asked Questions
How Can I Identify if Data Follows a Normal Distribution?
To determine if your data follows a normal distribution, start with histogram analysis to see if the data forms a bell-shaped curve. Next, perform skewness tests to measure symmetry; low skewness suggests normality. You can also use quantitative methods like the Shapiro-Wilk test. Combining visual inspection with statistical tests helps confirm whether your data aligns with a normal distribution, making your analysis more reliable.
What Are Common Real-World Applications of the Normal Distribution?
Imagine the normal distribution as the heartbeat of countless industries. You see it in statistical modeling, where it helps predict trends, and in quality control, ensuring products meet standards. It’s also essential in finance for risk assessment, in psychology for test scoring, and in healthcare for analyzing patient data. Its widespread use makes it the backbone of decision-making processes, helping you understand variability and make informed choices across various fields.
How Does Sample Size Affect the Normality of Data?
When considering how sample size affects the distribution shape, larger samples tend to produce data that more closely resemble a normal distribution. With bigger sample sizes, your data is less likely to be skewed or irregular, making the distribution more normal. Conversely, small samples may not accurately reflect the true population, leading to irregular or non-normal distribution shapes. So, increasing your sample size generally improves the normality of your data.
What Are the Limitations of Assuming Normal Distribution?
Imagine trying to fit a perfect circle into a square—assumptions about normal distribution can be just as limiting. You should know that assuming normality makes your analysis sensitive to outliers, which can distort results. Distribution assumptions may not hold true for skewed or bimodal data, leading you astray. Relying too heavily on normal distribution ignores real-world complexity, risking oversimplification and misinterpretation of your data’s true story.
How Do Skewed Data Sets Relate to the Normal Distribution?
You might notice that skewed data sets don’t fit well with the normal distribution because of skewness analysis, which reveals asymmetry. When data is skewed, it indicates the distribution isn’t symmetric, affecting your analysis. To handle this, you often perform data transformation techniques, like log or square root transforms, to reduce skewness and make the data more suitable for normal distribution assumptions.
Conclusion
Now that you’ve explored the normal distribution, imagine a world where data flows smoothly like a gentle hill—predictable and balanced. It stands in contrast to chaos, where data is scattered and unpredictable. By understanding this elegant curve, you gain the power to interpret patterns amid randomness. Embrace the simplicity of the bell curve, and you’ll see how it brings order to the complexity around you, turning uncertainty into clarity.