

A normal distribution is a symmetrical, bell-shaped curve that shows how most data points cluster around the average, with fewer points appearing as values move further away. It’s widely used in fields like finance, medicine, and social sciences to analyze patterns, predict outcomes, and make decisions. By understanding its characteristics and formulas, you can identify trends, detect outliers, and interpret data more accurately. If you keep exploring, you’ll discover how to apply these concepts effectively.
Key Takeaways
- Normal distribution is a symmetric, bell-shaped curve characterized by mean and standard deviation.
- It models natural phenomena like heights, blood pressure, and test scores.
- Used in finance for risk assessment and asset price modeling.
- Essential for hypothesis testing, confidence intervals, and data standardization.
- Visual recognition of the bell curve aids in assessing data normality for statistical analysis.
Understanding the Core Characteristics of Normal Distribution

Understanding the core characteristics of a normal distribution is essential because it forms the foundation for many statistical analyses. You’ll notice that a normal distribution is symmetric, meaning both sides mirror each other perfectly around the mean. The mean, median, and mode all sit at the center, making it unimodal with a single peak. Its tails extend infinitely but approach zero without touching the x-axis, showing it’s asymptotic. The total area under the curve equals 1, representing complete probability. This symmetry helps you analyze data efficiently and makes calculations more straightforward. The distribution is continuous, defined by just two parameters: the mean and standard deviation. Additionally, understanding the key components of a normal distribution allows for better interpretation of real-world data. These features allow normal distributions to model a wide range of natural and human phenomena accurately, facilitating the application of statistical inference in various fields.
Mathematical Foundations and Key Formulas

The mathematical foundations of the normal distribution are built around its defining formulas and parameters that describe its shape and behavior. You’ll use the probability density function (PDF), which is ( f(x) = frac{1}{sigma sqrt{2pi}} e^{-frac{1}{2} left(frac{x-mu}{sigma}right)^2} ), to calculate the likelihood of specific outcomes. The mean ((mu)) indicates the center, while the standard deviation ((sigma)) measures spread. You can standardize data with the z-score formula, ( z = frac{x-mu}{sigma} ), enabling comparisons across different datasets. The variance ((sigma^2)) quantifies data dispersion. Understanding these formulas allows you to analyze, compare, and interpret normal distribution data accurately. Additionally, the bell-shaped curve is a distinctive feature of the normal distribution, illustrating how data is symmetrically distributed around the mean. Recognizing the parameters of the distribution helps in modeling real-world phenomena more effectively.
Practical Applications Across Various Fields

Normal distribution models are essential tools across many fields, providing insights that guide decision-making and analysis. In economics and finance, you can use it to predict asset prices, manage risk, and evaluate returns on investments. Understanding the properties of the normal distribution helps in constructing more accurate models for these applications.
Normal distribution models are vital for decision-making and analysis across diverse industries.
Financial institutions rely on it to assess credit risk and forecast loan defaults, while models like Black-Scholes depend on normal distributions for option pricing. In medicine, it helps interpret blood pressure, height, weight, and blood glucose levels, aiding in health assessments and disease spread analysis.
Technology and engineering leverage it for quality control, noise analysis, and predicting component lifespan. In social sciences and education, IQ scores, test results, and social behaviors are modeled with normal distributions.
Business and marketing professionals use it for consumer insights, sales forecasts, and inventory management. Additionally, understanding the properties and parameters of the normal distribution enables more accurate modeling and predictions in these applications.
Using Normal Distribution for Data Analysis and Interpretation
Using normal distribution for data analysis and interpretation allows you to extract meaningful insights from data that follows this pattern. You can identify how data clusters around the mean, with most values falling within one or two standard deviations, thanks to the empirical rule. Forsale 100 Understanding the characteristics of the normal distribution can also help in identifying anomalies or outliers in your data. Standardizing your data using Z-scores helps compare different datasets and determines the likelihood of specific values occurring. This process supports hypothesis testing, confidence interval estimation, and regression analysis, where normality assumptions are essential. Additionally, recognizing the importance of community resilience can aid in making informed decisions during crises. By understanding the distribution, you can assess variability and make informed decisions. Tools like statistical software streamline this process, making it easier to analyze natural and social science data.
Visualizing and Recognizing the Bell Curve in Data

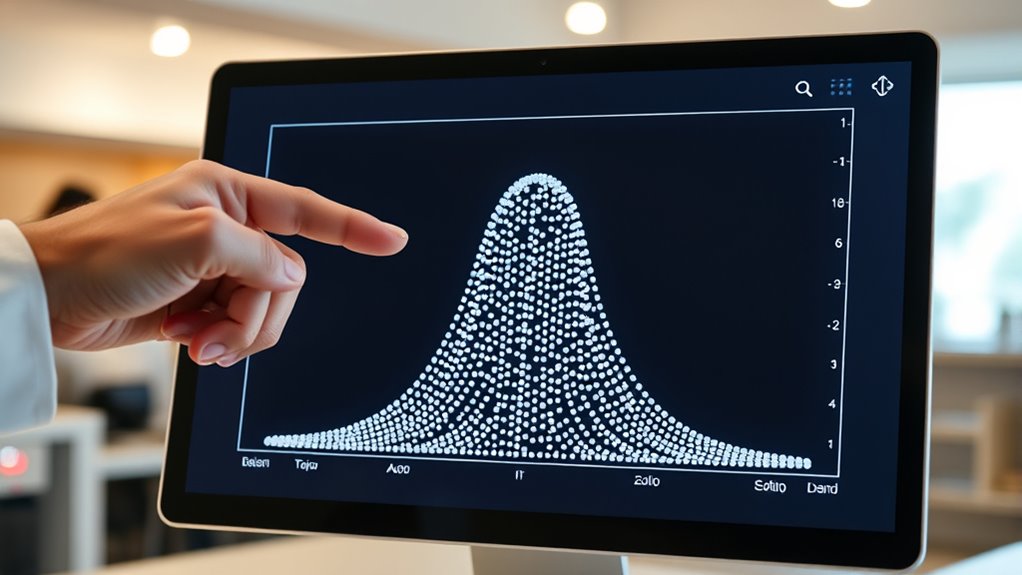
Visualizing the bell curve helps you quickly recognize when data follows a normal distribution. The normal distribution, or bell curve, is symmetric around its mean, with most data points clustered near the center and fewer toward the tails.
Visualizing the bell curve helps you quickly identify data that follows a normal distribution.
Its shape is tallest in the middle and tapers off gradually at both ends. The standard normal distribution, with a mean of 0 and a standard deviation of 1, provides a useful reference for comparison.
The area under the curve represents probability, with the entire area totaling 100%. Many natural phenomena, like heights and IQ scores, follow this pattern.
Recognizing the bell curve in data allows you to identify normality visually and apply relevant statistical tests, making your analysis more accurate and meaningful.
Frequently Asked Questions
How Does Skewness Affect the Normal Distribution’s Symmetry?
You wonder how skewness impacts the symmetry of a distribution. When a distribution has zero skewness, it’s perfectly symmetrical, like a normal distribution.
Positive skewness causes a longer right tail, making the distribution asymmetrical with more data on the left.
Negative skewness results in a longer left tail, skewing the distribution to the right.
Skewness signals asymmetry, affecting data interpretation and the accuracy of statistical analyses.
Can Data Ever Perfectly Follow a Normal Distribution? Why or Why Not?
Think of perfect normality like a flawless mirror, reflecting ideal symmetry. In reality, your data rarely follows this perfect shape because of outliers, skewness, or measurement errors.
While you can get close, no dataset is perfectly normal. Variations and anomalies make it impossible to achieve a true, flawless bell curve.
Still, understanding how your data approximates normality helps you make better decisions in analysis.
What Are Common Misconceptions About the Normal Distribution?
You might think all data follows a normal distribution, but that’s a misconception. Normal distributions are specific and symmetrical, yet many believe normalization makes data normal—this isn’t true.
Also, people often confuse correlation with independence and assume linear combinations of normal variables are always normal.
How Do Outliers Influence the Shape of a Normal Curve?
Think of the normal curve as a smooth, balanced boat. When outliers enter, they act like sudden waves, rocking the boat’s stability.
These extreme data points can stretch or skew the bell curve, making it asymmetrical or wider. As a result, the shape no longer accurately reflects the data’s true pattern, which can mislead your analysis.
Addressing outliers helps keep your data visualization steady and reliable.
Is the Normal Distribution Applicable to Small Sample Sizes?
You might wonder if the normal distribution works with small sample sizes. Generally, it’s not ideal because small samples often don’t meet the assumptions needed for normality.
Instead, you should use the (t)-distribution for small samples from a normal population, since it accounts for increased variability.
For very small samples, consider non-parametric tests or bootstrap methods to get reliable results.
Conclusion
By understanding the normal distribution, you can better analyze and interpret data in real-world situations. For example, recognizing that students’ test scores tend to follow a bell curve helps educators identify average performance and outliers. With this knowledge, you can make informed decisions, whether in quality control or healthcare. Mastering the normal distribution empowers you to uncover valuable insights and confidently navigate complex data across various fields.