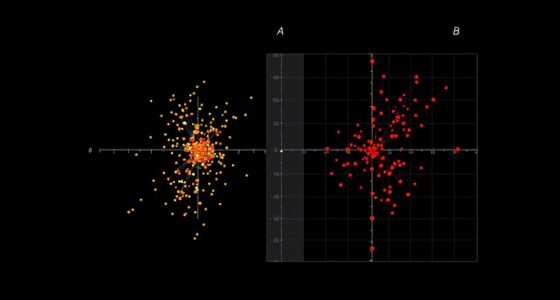
To calculate variance in Excel, first decide whether you’re working with a population or sample—use VAR.P for the entire population or VAR.S for a sample. Enter your data into a column or row, then select an empty cell and type the formula, like `=VAR.S(range)` or `=VAR.P(range)`, replacing “range” with your data range. Ensuring your data is clean and correctly formatted helps get accurate results, and if you keep exploring, you’ll find more ways to refine your variance analysis.
Key Takeaways
- Organize your data in a single column or row, ensuring all entries are numeric and free of blanks or errors.
- Use the appropriate function: VAR.S for sample variance or VAR.P for population variance.
- Enter the formula like `=VAR.S(range)` or `=VAR.P(range)` in an empty cell to calculate variance.
- Verify the data range is correct before pressing Enter to ensure accurate results.
- Interpret the variance value considering data context; higher values indicate more variability.
Choosing the Right Variance Function for Your Data

Choosing the right variance function in Excel depends on understanding your data’s nature. First, identify if your dataset represents the entire population or just a sample. Use VAR.P for population variance and VAR.S for sample variance, both handling only numerical data. If your dataset includes non-numeric values like text or logical entries, opt for VARPA or VARA, which include those values in calculations. The newer functions, VAR.S and VAR.P, are recommended over older ones like VAR and VARP, offering better performance. Additionally, understanding associated concepts like variance analysis can help interpret your results more effectively.
Preparing Your Data for Variance Calculation

To guarantee accurate variance calculations in Excel, you need to prepare your data carefully. Begin by organizing your raw data into a clean, tabular format, placing data points in a single column or row that matches the variance function’s input requirements.
Ensure all entries are numerical and consistent, removing or segregating irrelevant columns like identifiers or text labels. Use clear headers such as “Scores” or “Measurements” to prevent formula errors.
Scan for blank cells, outliers, or data entry mistakes, correcting or removing them to avoid skewed results. Convert text or logical values as needed, and apply data validation tools to prevent invalid input.
Highlight your data range precisely, avoiding gaps or non-numeric cells, to set a solid foundation for accurate variance calculation.
Calculating Variance Using Excel Functions

Excel provides several functions to calculate variance, allowing you to analyze data spread accurately based on your dataset type. If you’re working with a sample, use the VAR.S function, which is recommended for recent Excel versions due to its improved accuracy. High refresh rates are essential for capturing fast-moving action in gaming, and understanding variance can help assess performance consistency. For entire populations, choose the VAR.P function for precise results. The older VAR function is still available but is generally replaced by VAR.S and VAR.P. To apply these functions, select an empty cell, enter the formula like =VAR.S(range) or =VAR.P(range), ensuring your data range is correct. Press Enter to display the variance. These functions help you quantify data variability, which is essential in fields like finance and management. Analyzing data variability can provide insights into the consistency of your data sets. Always choose the appropriate function based on whether your data represents a sample or the full population.
Interpreting Variance Results

How do you interpret variance results effectively? First, recognize that a variance of zero means all data points are identical, indicating no variability. Higher variance values show greater data spread, but remember, variance is in squared units, so comparison with raw data can be less intuitive. Additionally, understanding the benefits of eye patches can help interpret how variance might reflect improvements in skin hydration or appearance over time. Use variance within the context of your specific analysis; for example, in ANOVA or regression, it helps identify how much data variability each factor explains. Considering data distribution is crucial, as variance assumes a normal distribution and may be misleading otherwise. Keep in mind, outliers can inflate variance, so consider their impact. You can also express variance as a percentage of total variability to understand each factor’s contribution. Ultimately, interpreting variance involves understanding its role in your statistical goals and recognizing its limitations, especially compared to more intuitive measures like standard deviation.
Handling Different Data Types in Variance Analysis

Handling different data types appropriately is crucial for accurate variance analysis. First, guarantee your data is consistent, formatted correctly, and organized logically in Excel to prevent errors. Clean your data by removing outliers and irrelevant entries, and decide whether to replace or ignore missing values based on your dataset’s context.
If working with categorical data, convert categories into numerical codes to enable variance calculations. Remember, variance is most meaningful with numerical data, whether continuous or discrete. For mixed data types, focus on the relevant numerical portions.
Normalize data if scale differences exist to prevent skewed results. By preparing your data carefully, you ensure your variance calculations accurately reflect the spread and variability within your dataset.
Updating Your Variance Calculation Methods for Better Accuracy

Using the right functions is essential to improve the accuracy of your variance calculations. Switch to VAR.S for sample variance, as it uses the “n-1” formula, offering more precise results and excluding non-numeric data. When tuning vehicles like the Kia Sedona or Kia Forte, understanding your data variability can be crucial, making accurate data analysis particularly important. For entire populations, use VAR.P, which considers all data points without bias adjustment. Avoid older functions like VAR and VARP, as they’re less accurate but still available for backward compatibility. Manual calculations can help deepen your understanding, but rely on built-in functions for efficiency and consistency. Always verify your data is clean, correctly formatted, and includes all relevant points. Selecting the appropriate function based on your dataset type and Excel version guarantees more reliable variance results, making your analysis more accurate and trustworthy. Incorporating diverse data sets can further enhance the robustness of your variance computations, especially when dealing with complex or varied data.
Frequently Asked Questions
Can I Use Variance Functions With Non-Numeric Data?
You can use variance functions with non-numeric data, but only if you choose the right ones. Functions like VARA and VARPA handle mixed data types, converting text and logical values into numbers for calculation.
However, most variance functions require numeric data and will return errors if they encounter non-numeric cells. To avoid issues, clean your data first or select functions compatible with mixed data types.
How Do I Choose Between Sample and Population Variance?
When choosing between sample and population variance, consider your data’s scope. If you have data for the entire group you’re studying, use population variance for a precise measure.
But if you’re working with a subset, opt for sample variance to estimate the overall variability.
Think about data availability and your analysis goal—this helps you select the right calculation method for accurate results.
What Are the Differences Between VAR.S and VAR.P?
Think of VAR.S and VAR.P as two explorers, each with a different map. VAR.S is your sample explorer, measuring variance in a subset, while VAR.P is your population explorer, evaluating the entire dataset.
They differ in formulas and purpose—VAR.S uses ( n-1 ), while VAR.P uses ( N ). Choose carefully: sample data for VAR.S, population data for VAR.P, to guarantee accurate insights.
Is There a Way to Calculate Variance for Filtered Data?
You wonder if you can calculate variance for filtered data in Excel. Standard functions like VAR.S and VAR.P don’t automatically adjust for filters.
To do this, you can manually calculate the mean of the filtered data, then compute the squared differences from that mean, and finally average those differences.
For dynamic results, consider using VBA scripts or custom formulas to automatically update variance based on your active filters.
How Does Excel Handle Blank or Missing Cells in Variance Calculations?
Imagine Excel as a diligent chef preparing a dish, carefully picking only the freshest ingredients. When it calculates variance, it ignores blank or missing cells like unwanted ingredients, focusing solely on the available data.
Built-in functions automatically exclude these gaps, ensuring your calculations remain accurate. You don’t need to do anything special—Excel’s smart enough to handle missing values, giving you precise results without fuss.
Conclusion
By mastering the methods to measure and manage your data’s variance, you empower your analysis and enhance your expertise. Remember, clarity comes from consistent calculation, confidence from correct choices, and control from careful data handling. With these skills, you’ll confidently calculate, interpret, and improve your insights. So, stay sharp, stay savvy, and steadily succeed in your statistical journey—because precision and progress go hand in hand.


