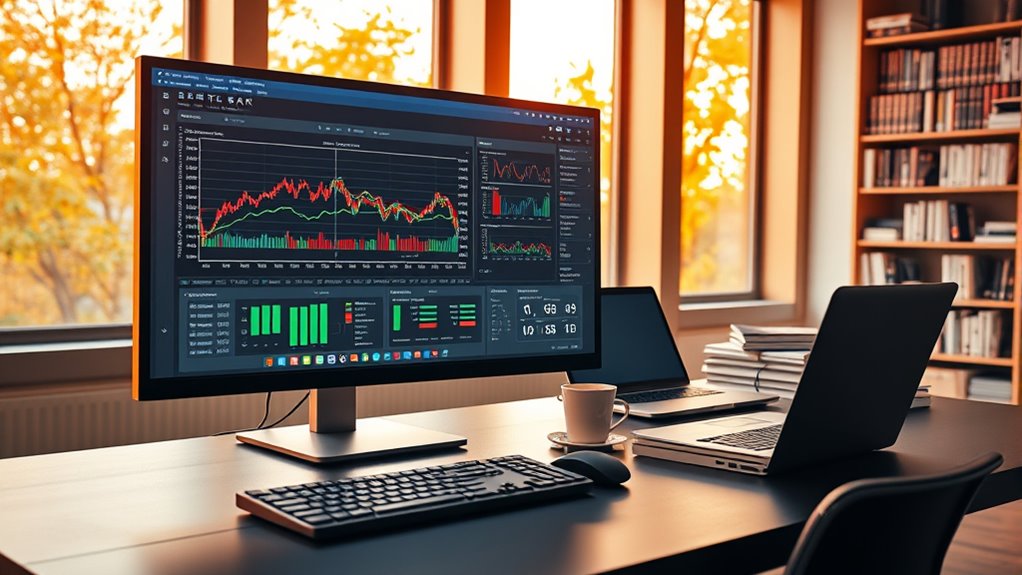
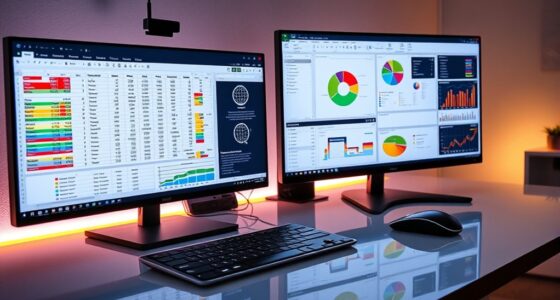
To master Gretl econometrics like a pro, start by exploring its intuitive interface and built-in tutorials to understand key features. Learn to identify trends, seasonal patterns, and stationarity issues in time series data, and apply models like ARIMA or GARCH for forecasting. Use panel data tools for multi-dimensional analysis, and automate tasks with scripting for efficiency. Keep exploring its diagnostic tools and visualization options—this will unlock advanced skills that can elevate your analysis to the next level.
Key Takeaways
- Master data import, cleaning, and transformation techniques to prepare datasets efficiently for analysis.
- Utilize advanced time series models like ARIMA, VAR, and GARCH for accurate forecasting and insights.
- Apply panel data methods such as fixed and random effects to analyze multi-dimensional datasets effectively.
- Automate repetitive tasks and complex analyses with Gretl scripting to enhance productivity and consistency.
- Leverage Gretl’s diagnostic tools and visualization features to thoroughly evaluate model validity and interpret results like a pro.

Gretl econometrics is a powerful, open-source software designed to make statistical analysis and economic modeling accessible and straightforward. Whether you’re analyzing time series data or working with panel data, Gretl provides the tools you need to derive meaningful insights. As you *plunge into* the software, you’ll quickly notice its user-friendly interface, which simplifies complex tasks, making it easier to focus on your analysis rather than struggling with technical hurdles.
When working with time series data, Gretl offers a variety of features that help you identify trends, seasonal patterns, and stationarity issues. You can easily import your datasets, whether they’re in CSV, Excel, or other formats, and then apply filters or transformations to prepare your data for analysis. The software supports common models like ARIMA, VAR, and GARCH, so you can model and forecast economic variables with confidence. Additionally, Gretl’s built-in diagnostic tools allow you to check for autocorrelation, heteroskedasticity, and structural breaks, ensuring your models are robust and reliable.
Handling panel data is equally straightforward in Gretl. You can import multi-dimensional datasets that contain observations across different entities over time, such as countries, firms, or regions. The software provides specialized estimators like fixed effects and random effects models, which help you control for unobserved heterogeneity. You can perform hypothesis testing, conduct panel unit root tests, and visualize your data through various plots, all within the same environment. This integrated approach simplifies the process of analyzing complex datasets, saving you time and reducing potential errors.
Gretl’s scripting capabilities give you even more control. You can automate repetitive tasks, run batch analyses, and customize your workflow to suit your specific needs. This is especially useful when working with large datasets or performing multiple model comparisons. The software also offers extensive documentation and tutorials, making it easier to learn and expand your skills, whether you’re a beginner or an experienced econometrician. Moreover, understanding the importance of high-quality data can significantly enhance your analysis outcomes.
Ultimately, Gretl empowers you to perform sophisticated econometric analysis without requiring expensive software or extensive programming knowledge. Its support for time series and panel data, combined with its intuitive interface and rich feature set, makes it an ideal tool for economists, researchers, and students alike. By mastering Gretl, you can confidently approach your data analysis projects, making informed decisions based on solid statistical foundations.
Frequently Asked Questions
Can Gretl Handle Large Datasets Efficiently?
Handling large datasets efficiently depends on your software and hardware. With Gretl, you might experience some limitations, but it can manage sizable data sets reasonably well, especially if you use data compression techniques to reduce memory load. To improve performance, guarantee your hardware meets recommended requirements, like ample RAM and a fast processor. While Gretl isn’t designed for massive datasets like some specialized tools, it’s still quite capable for most econometric analyses.
Is Gretl Suitable for Time-Series Analysis?
Ever wondered if Gretl’s the right tool for your time-series analysis? It definitely is! You can perform time series visualization to identify trends and patterns, and run stationarity testing to check if your data’s stable over time. Gretl’s user-friendly interface makes these tasks straightforward, so you can focus on your analysis without hassle. It’s a solid choice for anyone diving into time-series econometrics.
How Do I Import Data Into Gretl?
To import data into gretl, you start by opening the software and choosing the import option from the file menu. You can import various data formats like CSV, Excel, or Stata files. Simply select your data file, choose the appropriate import option, and follow the prompts. Gretl makes it easy to work with different data formats, allowing you to quickly get your data ready for analysis.
Can Gretl Perform Advanced Econometric Modeling?
Yes, you can perform advanced econometric modeling in Gretl. It supports complex techniques like model validation, allowing you to test the robustness of your models. You can also use simulation techniques within Gretl to assess different scenarios and forecast outcomes. Its user-friendly interface makes implementing these advanced methods manageable, giving you powerful tools to refine your analysis, validate your models, and explore various economic hypotheses effectively.
Is Gretl Compatible With Other Statistical Software?
Think of Gretl as a bridge connecting different worlds of software. It’s compatible with several statistical tools like R, Octave, and Python, making your workflow smoother. Its scripting capabilities allow you to automate tasks and customize analyses seamlessly. With this software integration, you can easily transfer data and results, enhancing your econometric modeling. So, yes, Gretl plays well with others, making your research process more efficient and flexible.
Conclusion
Mastering gretl is like wielding a superpower that can turn you into an econometrics legend overnight. With every command you learn, you’re revealing secrets that could make even the sharpest analysts bow in awe. Once you get the hang of it, you’ll be able to analyze data faster than a rocket, uncover insights that shock the world, and dominate the field. Get ready—gretl isn’t just a tool; it’s your secret weapon to econometric greatness!


