
If you’re new to Minitab, you’ll find it user-friendly and easy to navigate. It allows quick data import from files like Excel or CSV and offers a variety of visual tools such as histograms and scatter plots to find patterns easily. With guided analysis options like hypothesis testing and regression, it’s perfect for learning the basics of statistics. Exploring these features will boost your confidence and help you understand data analysis better—keep going to discover more about how Minitab can help you succeed.
Key Takeaways
- Minitab offers an intuitive interface designed for beginners to easily navigate and analyze data.
- It provides a variety of visual tools like charts and graphs to help new users interpret data patterns quickly.
- The software includes guided statistical procedures such as hypothesis testing and regression, suitable for learners.
- Extensive tutorials and step-by-step help resources support beginners in mastering Minitab features.
- Easy data import options from Excel or CSV enable quick setup and immediate exploration for new users.

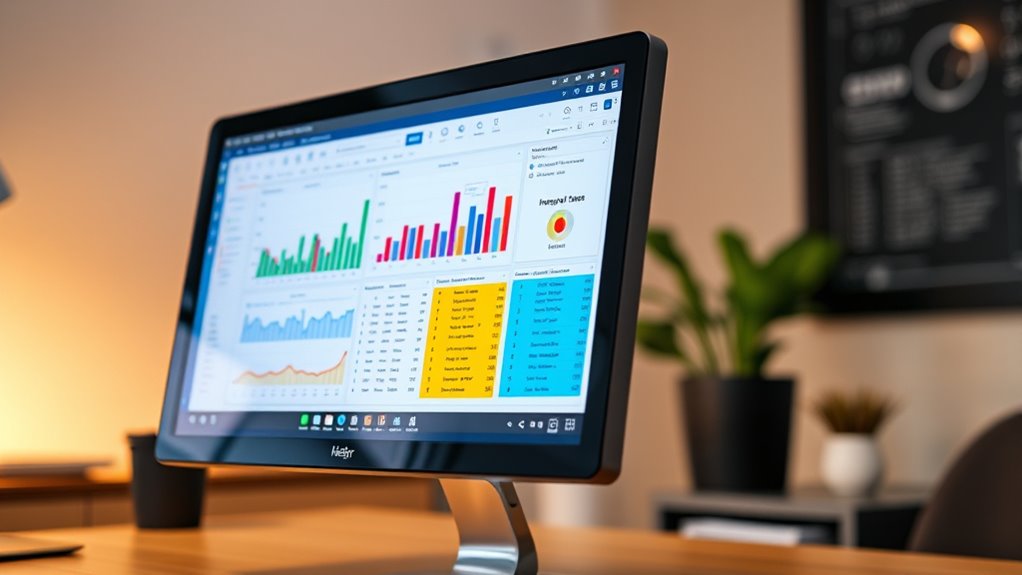
Are you new to Minitab and wondering how it can help analyze your data? If so, you’re about to discover a powerful tool that simplifies complex tasks like statistical analysis and data visualization. Minitab is designed to be user-friendly, making it easier for beginners to interpret data and make informed decisions. With its intuitive interface, you can quickly import datasets from various sources, such as Excel or CSV files, and start exploring your data right away. This ease of access encourages you to experiment and learn without feeling overwhelmed. Additionally, Minitab’s user support resources provide helpful tutorials and guidance tailored for beginners, enhancing your learning experience. When it comes to data visualization, Minitab offers a wide array of charts and graphs that help you see patterns, trends, and outliers clearly. Instead of sifting through raw numbers, you can generate histograms, scatter plots, boxplots, and control charts with just a few clicks. These visual tools allow you to communicate your findings more effectively, whether you’re presenting to colleagues or analyzing results for a project. Visualizations turn complex data into intuitive images, helping you grasp insights quickly and make data-driven decisions confidently. Statistical analysis is another core feature that makes Minitab invaluable for beginners. It provides straightforward procedures for descriptive statistics, hypothesis testing, regression analysis, and ANOVA. You don’t need to be a statistician to use these features; Minitab guides you through each step with clear prompts and explanations. For example, if you’re testing the effectiveness of a new process, you can run t-tests or ANOVA directly within the software, and it will interpret the results for you. This streamlined approach allows you to focus on understanding the data rather than wrestling with complicated calculations or software settings. Furthermore, Minitab’s built-in tutorials and help resources are designed to support newcomers. As you explore different analyses, you can access step-by-step guidance tailored for beginners, which boosts your confidence and accelerates your learning curve. The software also offers sample datasets to practice on, so you can get accustomed to various features before working on your own data.
Minitab beginner tutorial
As an affiliate, we earn on qualifying purchases.
As an affiliate, we earn on qualifying purchases.
Frequently Asked Questions
How Do I Interpret Minitab Output Results?
When interpreting Minitab output results, focus on understanding p-values and confidence intervals. A small p-value indicates strong evidence against the null hypothesis, suggesting your results are statistically significant. Confidence intervals show the range where the true parameter likely falls, helping you gauge precision. By analyzing these, you can better understand your data’s implications and make informed decisions, ensuring you correctly interpret the statistical significance and reliability of your findings.
Can Minitab Handle Large Datasets Efficiently?
Think of handling large datasets like managing a bustling city; you need efficient traffic flow. Minitab acts like a skilled traffic cop, guiding your data visualization and data management smoothly. While it can handle sizable datasets, performance depends on your computer’s power and data complexity. For peak efficiency, streamline your data and use Minitab’s tools wisely. It’s a reliable partner in transforming chaos into clarity, even with big data.
Is Minitab Compatible With Other Statistical Software?
You might wonder if Minitab is compatible with other statistical software. It does support data integration by allowing you to import and export data in common formats like Excel, CSV, and TXT, which makes it easy to work across different platforms. While Minitab isn’t directly integrated with all statistical tools, its software compatibility guarantees you can transfer data smoothly, facilitating a seamless workflow between various programs.
How Do I Customize Graphs and Reports in Minitab?
To customize graphs and reports, start by selecting your graph type and then use the formatting options to adjust colors, labels, and legends for better clarity. For report formatting, you can add titles, subtitles, and customize fonts and styles to make your report more professional. Use the toolbar and right-click menus to access specific customization features, ensuring your graphs and reports precisely match your presentation needs.
What Are Common Troubleshooting Steps for Minitab Errors?
Like a trusty sidekick, troubleshooting tips help you tackle Minitab error messages. When errors pop up, first restart the software—sometimes that’s all it takes. Check for software updates, verify your data is correct, and review your analysis steps. If issues persist, consult Minitab’s help resources or user forums. These simple troubleshooting steps can save your project from turning into a tech mess, just like a well-planned rescue mission.
data analysis software for beginners
As an affiliate, we earn on qualifying purchases.
As an affiliate, we earn on qualifying purchases.
Conclusion
Now that you’ve got a handle on Minitab basics, you’re ready to delve into and explore more. Remember, practice makes perfect, and don’t be afraid to roll up your sleeves and get your hands dirty. Every mistake is just another step toward mastery. Keep pushing forward, because once you plant your roots, you’ll see your confidence grow like a tree reaching for the sky. Stay curious, and your skills will flourish in no time.
Excel to Minitab data import tool
As an affiliate, we earn on qualifying purchases.
As an affiliate, we earn on qualifying purchases.
data visualization charts for beginners
As an affiliate, we earn on qualifying purchases.
As an affiliate, we earn on qualifying purchases.