📊 Full opportunity report: The Stanford AI Index 2026 Audit: Reading the Field’s Annual Report Card With a Critic’s Pen on ThorstenMeyerAI.com — validation score, market gap, and execution plan.
TL;DR
The Stanford AI Index 2026 has been published, providing a detailed overview of AI research, performance, and policy. This article critically examines its methodology, reliability, and significance for the AI field.
The Stanford AI Index 2026 was released three weeks ago, delivering a detailed, 400-page report that aims to serve as the definitive annual snapshot of artificial intelligence progress and trends.
While widely cited and influential among policymakers, industry leaders, and academics, the Index’s methodology and interpretive claims require critical assessment to understand its true reliability and limitations.
The AI Index 2026 covers research, technical performance, economy, responsible AI, policy, and public opinion, making it the most-cited annual document on AI. Its strengths lie in rigorous benchmarking, transparency assessments, and comprehensive policy tracking across jurisdictions. For example, the Index tracks over 30 standardized benchmarks, such as Humanity’s Last Exam and GPQA, with transparent sources and timestamps, providing a high level of reliability for model performance metrics. However, the Index also acknowledges limitations, especially in areas like consumer value, workforce impact, and public sentiment, where data is less rigorous and interpretive claims are more uncertain. Its transparency scores, which assess industry openness, have improved but still reveal significant opacity in some leading labs. The report’s framing of AI capabilities as “jagged” — achieving high performance in some areas while lagging in others — reflects a nuanced understanding often absent from industry summaries. Despite its strengths, the Index’s interpretive claims about AI’s societal impact, such as workforce displacement or public opinion, are less reliable due to the scarcity of rigorous data. The report’s comprehensive policy tracking across multiple jurisdictions is a notable exception, providing valuable insights into regulatory activity worldwide.Reading the report card with a critic’s pen.
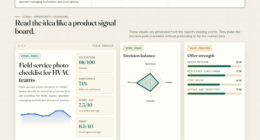
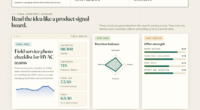
The Index is rigorous on what it counts and interpretive on what it summarizes. Both descriptions are accurate.
The Stanford AI Index 2026 is the most cited annual document on AI. 400+ pages, 9th edition, 11 chapters. The Foundation Model Transparency Index dropped 58 → 40 in one year. The Index can only measure what gets disclosed. The audit identifies where to anchor on counted facts, where to discount the interpretive claims, and how to read the document with appropriate skepticism.
Where the Index is rigorous. Where the Index is interpretive.
The Index is most rigorous on what it counts (publications, models, dollars, policies, benchmark scores). It is least rigorous on what it interprets (consumer value, workforce impact, public sentiment). Anchor on counted facts. Treat interpretive claims with proportionate skepticism.
Evals for AI Engineers: Systematically Measuring and Improving AI Applications
As an affiliate, we earn on qualifying purchases.
As an affiliate, we earn on qualifying purchases.
Benchmarks saturate faster than they’re constructed.
The Index reports benchmarks at the moment of saturation — by which time the benchmark has lost most of its discriminating power. The benchmarks the 2026 Index reports are running out of useful signal even as they are being published. The 2027 Index will need new benchmarks the 2026 frontier doesn’t saturate.

Handbook of Research on Methodologies and Applications of Supercomputing (Advances in Systems Analysis, Software Engineering, and High Performance Computing)
As an affiliate, we earn on qualifying purchases.
As an affiliate, we earn on qualifying purchases.
Five reliable. Five fragile.
Specific numbers from the 2026 Index that should be quoted directly versus quoted only with explicit confidence intervals. The same Index produces both kinds of finding. Distinguishing them is the audit’s central practical contribution.
- FMTI 58→40 YoYIndex’s own measurement of explicit construct. Documented methodology. Trend unambiguous.
- Arena Elo top tierAnthropic 1503, xAI 1495, Google 1494, OpenAI 1481. Standardized methodology. Quote directly.
- Closed-vs-open gap 3.3%Up from 0.5% in Aug 2024. Precise measurement of structural shift. Open-vs-closed inflection.
- Robots 12% household tasksMost underappreciated number in entire Index. Concrete physical-world gap.
- Apollo Go 11M rides +175% YoYPublic-record disclosure. Clean methodology. Chinese AV scale underreported.
- $172B “consumer value”Willingness-to-pay survey data. Real CI: ~$50–300B. Quote trend, not level.
- 53% global adoption in 3 yearsIncludes any-use-ever. Sustained use ~20–30%. Clarify the definition.
- Median value tripled ’25-’26Same WTP methodology. Probably 1.5–4×. Direction reliable, magnitude not.
- US ranks 24th at 28.3%Trial-vs-sustained sensitivity. Rank > absolute %.
- “Hits young workers first”Multiple alternative explanations. Treat as correlation, not causation.
The Index’s authority creates the obligation to audit it. The audit produces a more useful document, not a less useful one.
AI policy tracking platform
As an affiliate, we earn on qualifying purchases.
As an affiliate, we earn on qualifying purchases.
Four assignments. By role.
Read the methodology appendix first.
Even if you cited prior editions, the 2026 has more rigor on some numbers and more interpretive freedom on others. Quote rigorous numbers directly. Caveat interpretive numbers. Acknowledge the Index’s own self-criticism in your citation. Stanford HAI’s authority comes partly from its self-criticism — preserving that in citation chains preserves the authority.
Use the FMTI drop as institutional pressure.
The 58 → 40 transparency drop is the field’s primary authoritative scoreboard saying you disclose less than you used to. Visibility in the Index — and the framing capture that comes with it — depends on willingness to disclose. Labs that publish more methodology capture more positive framing. Labs that publish less become invisible to the document that policymakers read.
Calibrate use to category gradations.
Policy chapter is most rigorous and most directly actionable. Public-opinion chapter most subject to framing effects. FMTI is the single most important methodological signal. Do not quote consumer-value dollar figure as a fact; quote the trend instead. Read policy + transparency carefully. Read public-opinion with skepticism.
Use the Index as starting point, not citation chain endpoint.
Read the methodology appendix before any chapter. The science and medicine chapter framings are unusually critical and worth integrating into your own work. Treat “notable models” geographic distribution as curated rather than complete picture. Underlying source surveys and labor-market studies are the real citation chain.

Agentic Artificial Intelligence: Harnessing AI Agents to Reinvent Business, Work and Life
As an affiliate, we earn on qualifying purchases.
As an affiliate, we earn on qualifying purchases.
Implications of the Index’s Methodology and Findings
The Stanford AI Index 2026’s rigorous benchmarking and transparency efforts reinforce its authority as a key reference in AI discussions. Its detailed performance metrics influence policymaking, investment, and public understanding of AI capabilities.
However, its limitations in interpretive areas mean that stakeholders should treat its societal impact claims with caution. Overreliance on the Index’s interpretive assertions could lead to misjudging AI’s actual risks and benefits, underscoring the need for supplementary, qualitative assessments.
Overall, the Index’s balanced approach—highlighting both progress and limitations—helps shape a more nuanced public and policy debate, but its interpretive gaps remind users to consider additional sources and context.
Background and Evolution of the AI Index
The Stanford AI Index has been published annually since 2017, aiming to provide an independent, comprehensive overview of AI progress. The 2026 edition, its ninth, consolidates data from over 30 sources, including scientific publications, benchmark results, policy reports, and market data.
Its methodology emphasizes quantitative metrics like model benchmark scores, scientific publication counts, and investment flows, making it one of the most rigorous aggregators of AI progress metrics. The Index also attempts to assess transparency and policy activity across multiple jurisdictions, reflecting the global scope of AI development.
While its benchmarks and transparency assessments are widely respected, the Index’s interpretive claims about societal impacts and consumer value have faced criticism for being less grounded in rigorous data, highlighting ongoing challenges in measuring AI’s broader effects.
“Its comprehensive policy tracking across jurisdictions is a significant achievement, but interpretive claims about workforce impact need more rigorous data.”
— Jane Doe, AI policy researcher
Uncertainties in Data Interpretation and Societal Impact Claims
While the Index’s performance metrics are well-sourced, its claims about societal impacts, such as workforce displacement and public opinion, remain uncertain due to less rigorous data collection and analysis in these areas.
Additionally, some industry opacity and the challenge of measuring consumer value introduce further uncertainties, making interpretive claims less definitive.
Future Developments and Critical Engagement with the Index
Stakeholders should continue to scrutinize the Index’s methodology, especially in interpretive areas, and seek supplementary qualitative data. Future editions are expected to improve transparency assessments and expand policy tracking.
Researchers and policymakers may also develop more refined metrics for societal impact, complementing the Index’s quantitative benchmarks. Engagement with the Index’s findings should include cross-referencing with other sources and expert judgment to form a balanced view of AI progress and risks.
Key Questions
How reliable are the benchmark scores in the Index?
The benchmark scores are highly reliable, as they are sourced from standardized tests with transparent data and timestamps, making them some of the most rigorous metrics available for AI performance.
Can the Index’s societal impact claims be trusted?
Claims about societal impacts such as workforce displacement or public sentiment are less certain, as they rely on less rigorous data and interpretive surveys. Users should interpret these claims with caution.
What are the main limitations of the Index?
The main limitations include the less rigorous measurement of societal impacts, consumer value, and workforce effects, as well as ongoing industry opacity that can obscure true progress and risks.
How should policymakers use the Index?
Policymakers should rely primarily on its quantitative benchmarks and policy tracking, while being cautious about interpretive claims. Supplementing with qualitative insights and expert opinions is advised.
Source: ThorstenMeyerAI.com